4.8 Example: Sizes of oysters
To demonstrate the Kolmogorov-Smirnov test in PRIMER, we shall return to the dataset consisting of length measurements (in mm) of the Sydney rock oyster (Saccostrea commercialis) settling on four different types of surfaces in intertidal estuarine environments (deployed as 10 cm x 10 cm settlement panels at an oyster farm) in Quibray Bay, New South Wales, Australia ( Anderson (1992) , Anderson & Underwood (1994) ). Rock oysters comprised one of the dominant species colonising the settlement panels in this study (in terms of area), and interest lies in examining the distributions of sizes of these oysters on different types of surfaces.
The data are contained in the file 'Quibray_oyster_sizes.pri', found in the 'Quibray_oysters' folder in 'Examples_P8'. These data were also examined in sections 2.2 and 3.2 above. Each row of the data file contains the length measurement for an individual oyster (in mm), and the factor 'Substratum' identifies the type of surface (concrete, marine plywood, fibreglass or aluminium) to which each measured oyster was attached.
Here, we shall test the null hypothesis of no difference in the distribution of sizes of oysters colonising the concrete surfaces vs those colonising marine plywood surfaces.
- Open the file named 'Quibray_oyster_sizes.pri' in PRIMER 8. Run the Kolmogorov-Smirnov test by clicking Analyse > Univariate > Kolmogorov-Smirnov..., as shown below.
![01.Kolmogorov-Smirnov_menu_item[ii].png](https://learninghub.primer-e.com/uploads/images/gallery/2025-12/6bk01-kolmogorov-smirnov-menu-item-ii.png)
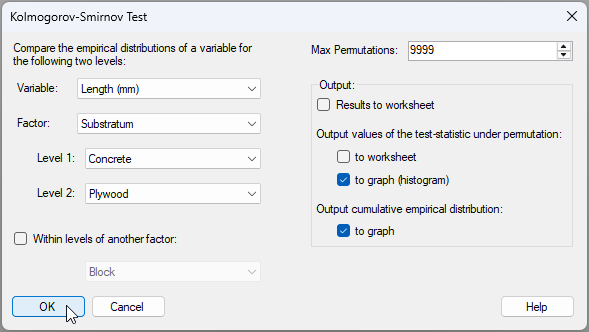
- In the resulting Kolmogorov-Smirnov Test dialog, choose the following:
- Variable: Length (mm)
- Factor: Substratum
- Level 1: Concrete
- Level 2: Plywood
- Max permutations: 9999
- Output values of the test-statistic under permutation: $\checkmark$to graph (histogram)
- Output cumulative empirical distribution: $\checkmark$to graph
then click 'OK', as shown below.
- Running the test yields a file that shows all of the choices made by the end-user ('Parameters'), as well as the results of the test ('Results'), viz:
![03.Kolmogorov-Smirnov_results[ii].png](https://learninghub.primer-e.com/uploads/images/gallery/2025-12/03-kolmogorov-smirnov-results-ii.png)
A histogram of the distribution of the test-statistic (D) is also provided, as shown below ('Graph1'):
![04.Kolmogorov-Smirnov_histogram[i].png](https://learninghub.primer-e.com/uploads/images/gallery/2025-12/04-kolmogorov-smirnov-histogram-i.png)
A natural graphic to look at here, to accompany the test and to help characterise the two distributions of oyster sizes, is an Empirical Distribution plot (provided as 'Graph2' in the Explorer tree, and shown below).
![05.Empirical_Distributions_Concrete&Plywood[i].png](https://learninghub.primer-e.com/uploads/images/gallery/2025-12/05-empirical-distributions-concrete-plywood-i.png)
There was a significant difference between concrete and marine plywood surfaces with respect to the distribution of sizes of oysters on them ($D$ = 0.184, $P$ = 0.0001). Clearly, there were proportionately many more oysters of larger sizes on concrete surfaces, compared to marine plywood. This is highly likely to have been caused by more rapid initial colonisation of oysters on the alkaline surfaces of concrete in the early stages of deployment, and faster growth of oysters on concrete over time ( Anderson (1996) ).