4.6 Example: A bivalve species from Ekofisk
We will use the Kruskal-Wallis test to compare counts of a bivalve species, Abra prismatica, occurring at sites classified into groups according to their proximity to the Ekofisk oilfield in the North Sea ( Gray et al. (1990) ). Macrofauna were sampled from each of 29 sites that were laid out roughly along five transects that radiated out from the centre of the oil platform. The sites were classified into 4 strata, based on their relative distance from the oil platform. These 4 strata (groups) of sites were defined and labeled as: A (> 3.5 km), B (1 km - 3.5 km), C (250 m - 1 km) and D (< 250 m). There were three day-grab sampling units taken from each site; data from these three units were combined to yield abundance values for each of p = 173 soft-sediment macrofaunal taxa at every site.
Running the Kruskal-Wallis test
- Open up the example data file in PRIMER. These data are located in the file named ‘Ekofisk_macrofauna_counts.pri’, found inside the 'Examples_P8 > Ekofisk_macrofauna' folder.
![01.Ekofisk_data[i].png](https://learninghub.primer-e.com/uploads/images/gallery/2025-12/01-ekofisk-data-i.png)
Note that there is no need to do any transformations on these data, as there would be no effect of a monotonic transformation on this univariate non-parametric test. This is simply because the ranks of values, upon which the test depends, are naturally not in any way changed by such a transformation.
- Now run the analysis. From the 'Ekofisk macrofauna counts' data sheet, click Analyse > Univariate > Kruskal-Wallis...
![02.Ekofisk_data+Kruskal-Wallis_menu_item[i].png](https://learninghub.primer-e.com/uploads/images/gallery/2025-12/02-ekofisk-datakruskal-wallis-menu-item-i.png)
-
Choose the following options in the 'Kruskal-Wallis Test' dialog window:
- Variable: Abra prismatica
- Factor: Dist
- $\checkmark$Pairwise comparisons
- Max permutations: 9999
- $\checkmark$Output box plot
- Output values of test-statistic under permutation: $\checkmark$to graph, then click 'OK'.
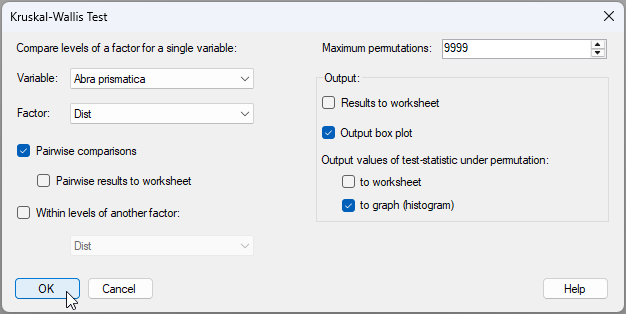
You may note in passing that it is also possible via this dialog to run the Kruskal-Wallis test separately within levels of another factor, in cases where there may be greater complexity in the design (e.g., crossed factors).
Results of the Kruskal-Wallis test
The resulting notepad (![Notepad_[i].png](https://learninghub.primer-e.com/uploads/images/gallery/2025-12/notepad-i.png) , *.rtf) file named 'Kruskal-Wallis Test1' contains all of the essential elements of this analysis and its results. First the choices that were made by the user ('Parameters') are shown:
, *.rtf) file named 'Kruskal-Wallis Test1' contains all of the essential elements of this analysis and its results. First the choices that were made by the user ('Parameters') are shown:
![04a.Kruskal-Wallis_Results_file[i].png](https://learninghub.primer-e.com/uploads/images/gallery/2025-12/04a-kruskal-wallis-results-file-i.png)
This information is followed by the full suite of results, including all of the relevant supporting calculations ('Results'), viz.:
![04b.Kruskal-Wallis_Results_file[i].png](https://learninghub.primer-e.com/uploads/images/gallery/2025-12/04b-kruskal-wallis-results-file-i.png)
We can reject the null hypothesis that the four groups of sites are equal with respect to counts of Abra prismatica ($H$ = 12.77, $P$ = 0.0024) and conclude that some of these groups differ from one another. The pairwise comparisons show statistically significant differences between group D (the sites closest to the oil platform) and all other groups ($P$ < 0.015 for all of those tests). Groups A and B do not differ significantly from one another ($P$ > 0.68), nor do groups B and C ($P$ > 0.10), while the comparison between groups A and C approaches significance at the 0.05-level ($P$ = 0.06). The median of Abra prismatica abundance values in each group are also given directly in this output file.
The results are clarified by the graphical outputs (shown under 'MultiPlot1'). The boxplot ('Graph1') shows how the distributions change across the sites, with greater median abundances per site being observed far away fom the oil platform (groups A and B); almost no individuals of this species were observed near the platform (group D).
![05.Abra_boxplot[i].png](https://learninghub.primer-e.com/uploads/images/gallery/2025-12/05-abra-boxplot-i.png)
We also see a histogram of the empirical distribution of the $H^{\pi}$ values under permutation ('Graph2', shown below). Clearly the observed value ($H_\text{obs}$, the veritcal dotted line) is quite unusual (far out in the right-hand tail) by comparison with this empirical distribution for our test-statistic that was generated under a true null hypothesis.
![06.Abra_K-W_histogram[i].png](https://learninghub.primer-e.com/uploads/images/gallery/2025-12/06-abra-k-w-histogram-i.png)
Taken all together, these results indicate that the bivalve, Abra prismatica, is strongly and negatively affected by oil drilling at sites occurring within 250 m (in any direction) of the Ekofisk oil platform (group D), where their median abundance was effectively reduced to zero. Median abundance was also reduced (compared to background levels) at sites occurring between 250 m and 1 km away from the oil platform (group C). At distances greater than 1 km, however, no further effects of the Ekofisk oil platform on median abundances were detected (groups A and B).
One may wish to apply the test on some other individual species of interest from the Ekofisk dataset (e.g., Montacuta substriata, Eteona longa, Goniada maculata, etc.) or perhaps on some univariate metric of diversity or abundance (such as richness, even-ness or total abundance), derived from the multivariate data. Note that you can use PRIMER's Analyse > DIVERSE... routine to obtain a wide variety of diversity metrics from multivariate data for subsequent analysis.