6.4 Multivariate Behrens-Fisher problem
Overview
In a multivariate context, there are many ways that groups of sampling units can differ from one another. For example, let's consider conceptually just three important ways that groups (i.e., sets of sampling units in a multivariate space) can differ from one another (see Fig. 6.1). (There are more ways, of course)! They can differ in the position of their central location (centroids), in the overall variability of their sampling units (dispersion or spread), and/or in their degree of correlation among pairs of variables (shape).
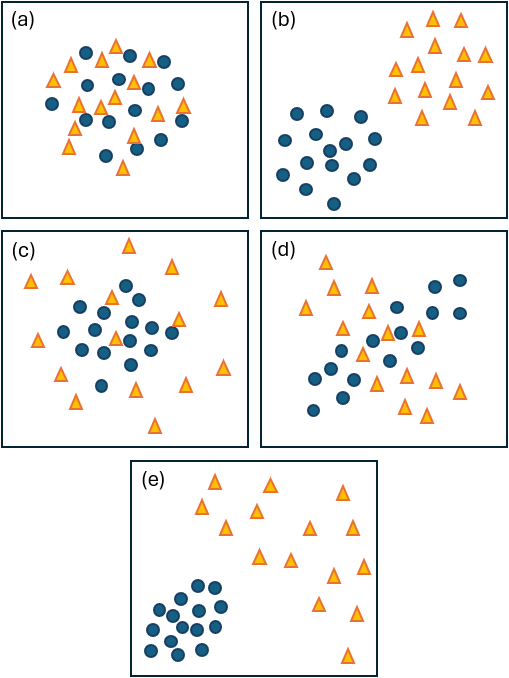
Fig. 6.1. Schematic diagram of bivariate data in each of two groups (triangles vs circles) where the groups have: (a) similar centroids, spread and shape; (b) different centroids (a shift in the central location of the points); (c) different spread (triangles are more dispersed); (d) different shapes (triangles show a pattern of negative correlation, while circles show a pattern of positive correlation); and (e) different centroids, different overall spread and different shapes.
The multivariate Behrens-Fisher problem in classical statistics is typically stated as the problem of testing for the equality of mean vectors (centroids) from two or more multivariate normal distributions (groups or populations), when their covariance matrices (describing the shape and dispersion of the samples within each group) are possibly not equal.
The majority of solutions to the multivariate BFP (e.g., see Johnson & Weerhandi (1988) , Coombs & Algina (1996) , Christensen & Rencher (1997) , Gamage et al. (2004) , Belloni & Didier (2008) , Krishnamoorthy & Lu (2010) ) assume variables are multivariate normal and also do not handle high-dimensional data, where the number of variables can exceed the sample sizes (but see Ahmad et al. (2012) and Ahmad (2014) for some proposed non-parametric solutions to the multivariate BFP based on U statistics).
However, we would really like a solution to the multivariate BFP for dissimilarity-based approaches (such as ANOSIM or PERMANOVA). In this context, the somewhat more general multivariate BFP would be stated as:
- How can we test for differences in central location (in the multivariate space defined by a given resemblance measure) when there are differences in dispersion (spread) among the groups?
We may begin by doing a test for homogeneity of multivariate dispersions using the PERMDISP routine in PRIMER (see Anderson (2006) and Anderson et al. (2006) ). If we find significant differences in spread among the groups, then we may consider how this might affect any test we may wish to perform using either ANOSIM or PERMANOVA.
Effects of heterogeneous dispersions on dissimilarity-based tests
ANOSIM
Anderson & Walsh (2013) did a simulation study to investigate how ANOSIM and PERMANOVA would be affected by variation in multivariate dispersions. They found that ANOSIM was very strongly affected by heterogeneity. Specifically, the ANOSIM test is sensitive to:
- differences in location (centroids);
- differences in dispersion; and/or
- differences in shape.
ANOSIM's null hypothesis may be put simply as 'there are no differences among the groups', so any of these types of differences (individually or collectively), might trigger a significant result in an ANOSIM test. Although ANOSIM is more likely to reject the null hypothesis for changes in location (centroid), it does not set out to be a test for differences in location only - it is a test of any differences between groups that might render them 'distinctive'. Indeed, the R statistic in ANOSIM might best be regarded as a measure of the distinctiveness of the groups (see Clarke (1993) and Warwick & Clarke (1993) ).
PERMANOVA
In contrast, PERMANOVA is much more akin to classical ANOVA. It performs a partitioning of the variability in the space of the resemblance measure, and therefore is focused much more strongly on detecting shifts in location. PERMANOVA tests the more specific null hypothesis: 'there are no differences among the group centroids' in that space. The behaviour of PERMANOVA in the face of heterogeneous dispersions also mirrors what has been found for the classical univariate $F$ test. Specifically, Anderson & Walsh (2013) found that PERMANOVA was not affected by heterogeneous dispersions if the design was balanced (equal sample sizes per group). However, if the design was unbalanced (unequal sample sizes per group), then, precisely as in a univariate $F$ test, PERMANOVA was:
- conservative (yielding an inflated Type II error rate) if a group (or groups) with a large sample size also had large variation relative to other groups; and
- liberal (yielding an inflated Type I error rate) if a group (or groups) with a small sample size also had large variation relative to other groups.
In other words, if a group with a large sample size is greatly dispersed, then it wil be very difficult to detect a true shift in the centroids; the large within-group dispersion of that group will dominate the analysis (Fig. 6.2a). On the other hand, if a small sample-sized group has large dispersion, then even small differences in the sample centroids entirely due to random sampling might look relatively large (and be detected as significant) relative to the small within-group dispersion seen in other groups (Fig. 6.2b).
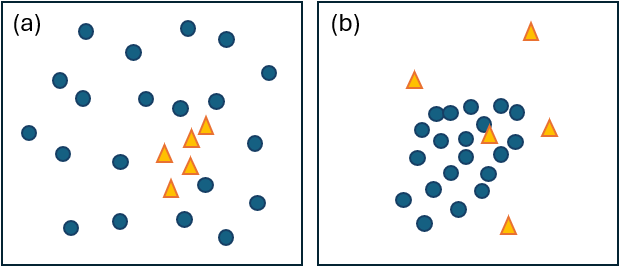
Fig. 6.2. Schematic diagram showing how imbalance can affect tests for differences in centroid in PERMANOVA: (a) large dispersion in a group with a large sample size will increase Type II error, hence decrease the power of the test; (b) large dispersion in a group with a small sample size will increase Type I error.