2-way crossed ANOSIM (Tasmanian crabs study)
An example of a 2-way crossed layout was introduced in Section 1, for meiofaunal communities in sediment patches either disturbed or undisturbed by soldier crabs (treatment factor Trt, levels D/U, factor A), over four areas of Tasmanian sandflat (block factor Blk, levels 1-4, factor B), with two replicates for each of the 8 combinations. Setting up of these factors was described in Section 2. Open (or create) the workspace Tasmania ws with datasheet Tasmania nematodes, take a fourth-root transform and compute Bray-Curtis similarity, renamed Nem B-C. Run this through nMDS and note the way the samples split rather convincingly between the effects of the different regions of sandflat (blocks, roughly across the page) and disturbed or undisturbed (treatments, roughly up the page; click on the Blk-Trt key to change symbol type/colour for blocks and open/closed for treatments). There are so few replicates, however, that this is not clear-cut and does need testing. Also, stress is quite high (about 0.16) so the picture may be misleading, and the test needs to be in the full-dimensional space represented by the resemblance matrix, as ANOSIM tests always are. Two-way crossed ANOSIM is carried out for the null hypotheses, H$_0$: no treatment effect, allowing for the fact that there may be differences between blocks, and also symmetrically for H$_0$: no block effect, allowing for the fact that there may be treatment effects. The test statistic for treatments is now the average of the 1-way ANOSIM R values for testing the treatments separately within each block, and the permutation procedure is also a constrained one, within blocks (see Chapter 6 and Fig. 6.7 of CiMC, which analyses the same study but for the full meiofaunal data – nematodes and copepods combined – for which the outcome is even clearer). Here, with Nem B-C as the active sheet, take Analyse>ANOSIM>(Model: Two-Way Crossed - AxB)>(Factors A: Trt & B: Blk) and both factors are treated as unordered (the treatment only has two levels anyway, and though the block areas will vary in their nematode assemblages there is no expectation that this will be on a strong gradient). Again, note that we could have restricted the analysis to use only some of the levels of either factor, with the Levels buttons, though this is not appropriate here.
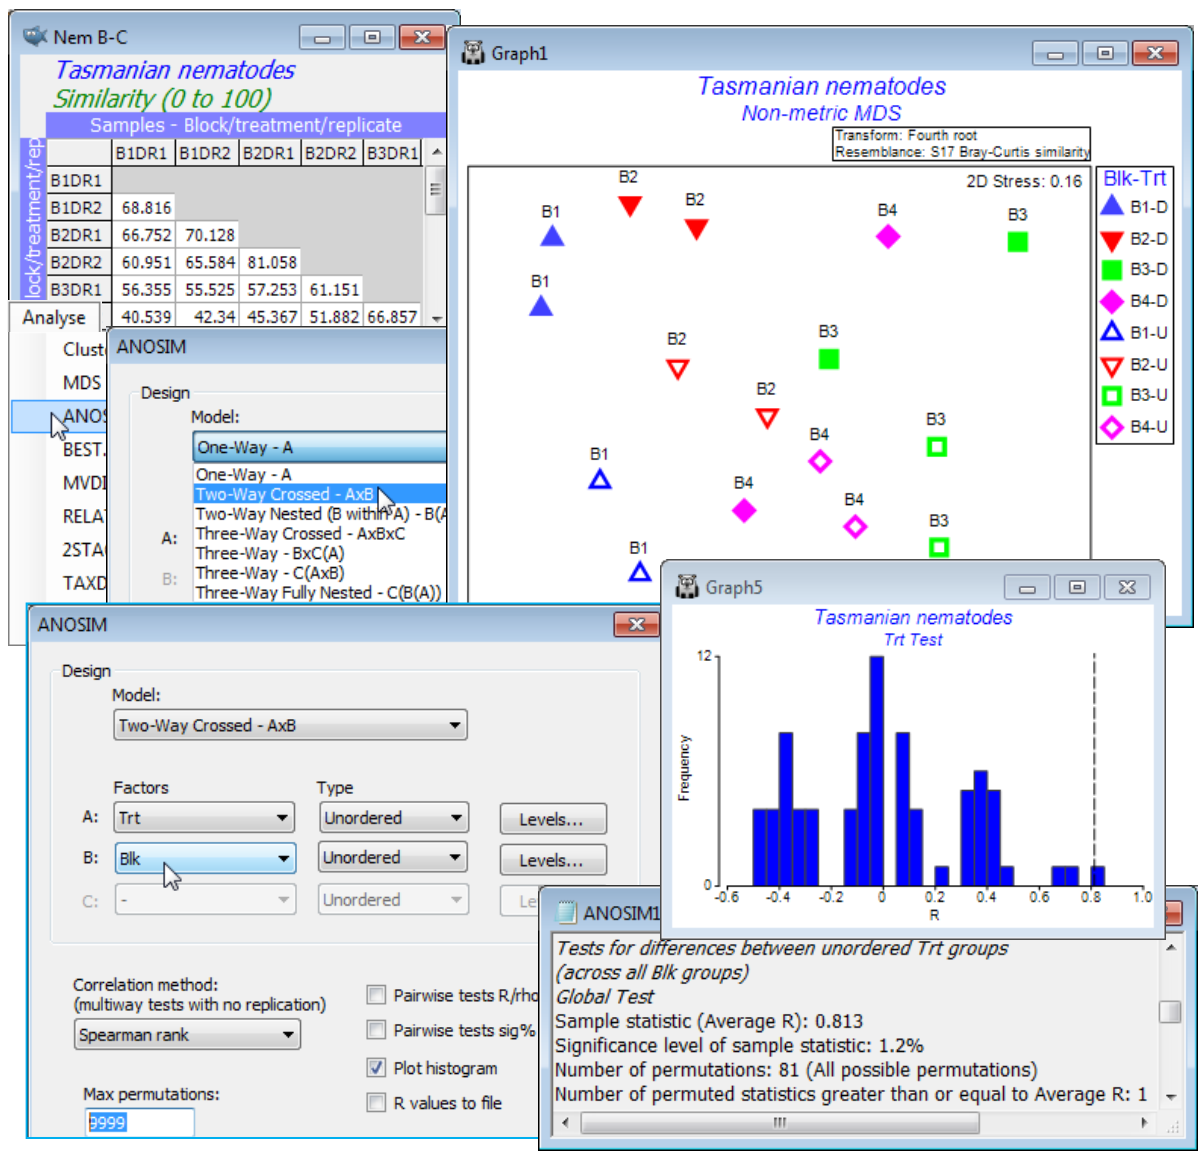
For the test of the treatment effect, the histogram shows a typical null distribution for the ANOSIM test statistic when there are few replicates. With only 81 distinct permutations permitted (these correspond to all ways of simultaneously exchanging the four replicates within each block), the range of values that the statistic can take when there is no treatment effect is not at all smooth. This demonstrates why the null permutation distribution has to be recreated for each new data set and cannot rely on standard tables or distributional forms. And clearly there is no point for this test in increasing to (Max permutations: 9999), as we have done here – there are only 81 permutations and ANOSIM does them all. Nonetheless, the results in ANOSIM1 show that the observed statistic for testing treatments (global R = 0.813) is the largest obtainable for the 81 permutations, so gives a significance level of 1 in 81 (p = 1.2%). This would normally be considered sufficient to cast doubt on the null hypothesis of no treatment effect. If there were more than two treatments, the global test would be followed by pairwise comparison of treatments, exactly as for the 1-way ANOSIM case.
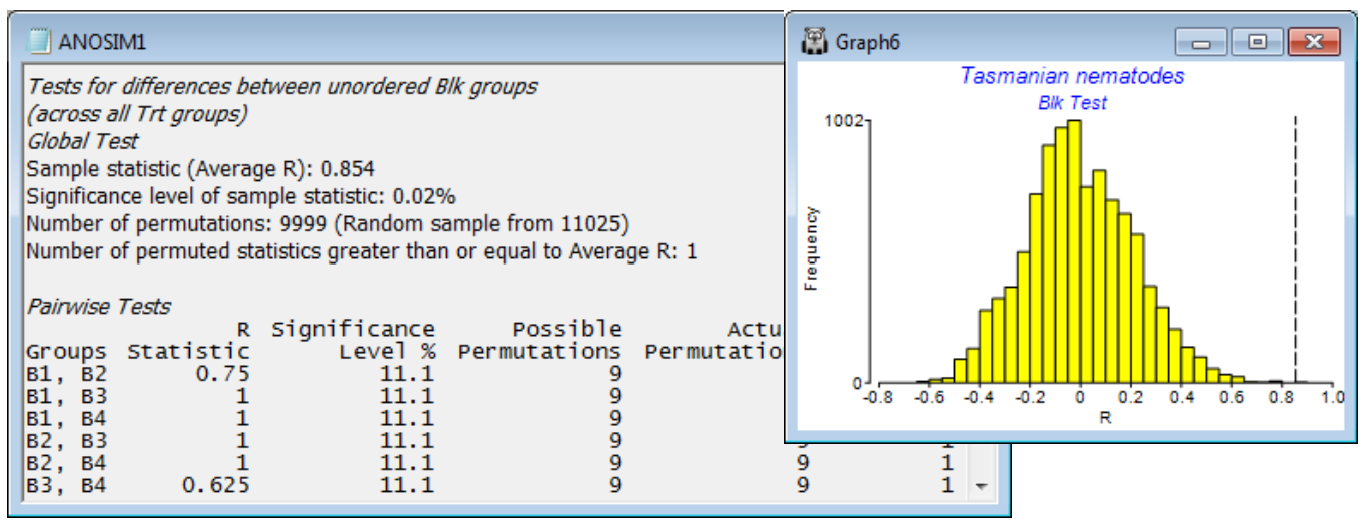
The second plot is much smoother because there are 11025 possible permutations of the replicates across blocks within each treatment, corresponding to the null hypothesis of no block effect, and a random subset (with replacement) of most of them has been evaluated. In fact, having seen that there are only 11025 to find, it would make sense to repeat the analysis, setting (Max permutations: 12000) – or any number >11025 – because ANOSIM will then compute the full set of 11025. But this was not done here, and the observed average R of 0.854 was seen to be the most extreme of all but one of the 9999 permutations examined – almost certainly that one was the real configuration but we cannot guarantee that if not all the permutations are evaluated, so the significance level is a (slightly conservative) 2 in 10000, i.e. p<0.02%. There is little merit in then considering the pair-wise tests of Block1 v Block2, Block 1 v Block3 etc. The key thing to have established is that there are natural changes in the nematode assemblage across the sandflat, so that removing this block factor from the test for treatments was worthwhile (the nMDS shows that a 1-way design in which block-to-block changes become part of the replicate variability would largely fail to pull out the treatment effect). Individual block differences are not of interest, but if they were, the Pairwise Tests table in ANOSIM1 shows that all blocks are well separated from each other (all pairwise R values are large). Note that none of these pairwise comparisons has enough replicates (and thus permutations) to allow a sensible significance test. In all cases the observed configuration is the most extreme permutation, best separating the two blocks, but with only 9 permutations that gives significance of only p = 11.1%. It is not logical to conclude that there are no differences between any pair of blocks when the global test has just shown that there are massive and highly significant differences amongst all four blocks! As remarked for 1-way ANOSIM, the focus should be on showing significance of the global R (otherwise pairwise comparisons should not be pursued) and then the pairwise R values themselves, to see where the large effects are (here, between all pairs).