Running Type 3 SIMPROF
Type 3 SIMPROF can be run as a single test on the species set defined by the active matrix (which could be under a selection), using Analyse>SIMPROF>(Type•Type 3), leading to similar dialog and outputs as for the Type 2 test. However, there are two important differences. Firstly, as noted above, it is now essential that the input matrix is species-standardised, for the permutations to make any sense. Secondly, even if all species in the (reduced) data matrix – Data2 in the above context – are submitted to this single run of Type 3 SIMPROF, the procedure is not testing the same null hypothesis as the Type 2 test. That seeks to reject the null hypothesis of no associations amongst any of the pairs of species; Type 3 tests the null that all associations amongst pairs of species in that set are the same. Clearly, it is at least possible (albeit not very likely in practice) for the Type 2 test to reject its null hypothesis, so that there is statistical support for examining the structure of the among-species relationships, but that this further study – which starts with a Type 3 test of all the species – fails to find any species clusters at all. This would happen if all species had exactly the same strong pattern (subject to sampling error) over the samples, e.g. there might be a single strong environmental gradient and all species abundances decline at the same rate along that gradient.
As implied in that comment, a Type 3 test is rarely performed singly. More typically, a series of Type 3 tests are carried out automatically, working down the branches of a hierarchical species clustering, in order to determine the coherent species sets, i.e. all the nodes which give rise to non-significant Type 3 tests. Structure displayed in the species clustering below that point is always in red, indicating that there is no statistical support for interpreting these further sub-divisions. Whilst Wizards>Coherence plots only performs group average (UPGMA) clustering – though using any selected association/correlation coefficient – the other hierarchical clustering methods offered by PRIMER 7 can be applied to variable resemblances by running Analyse>Cluster> and choosing the agglomerative CLUSTER (and an alternative linkage method) or the divisive unconstrained UNCTREE, and specifying (✓SIMPROF test), see Section 6. [Even the constrained LINKTREE routine (Section 13) would run, though defining sensible constraints might prove elusive!].
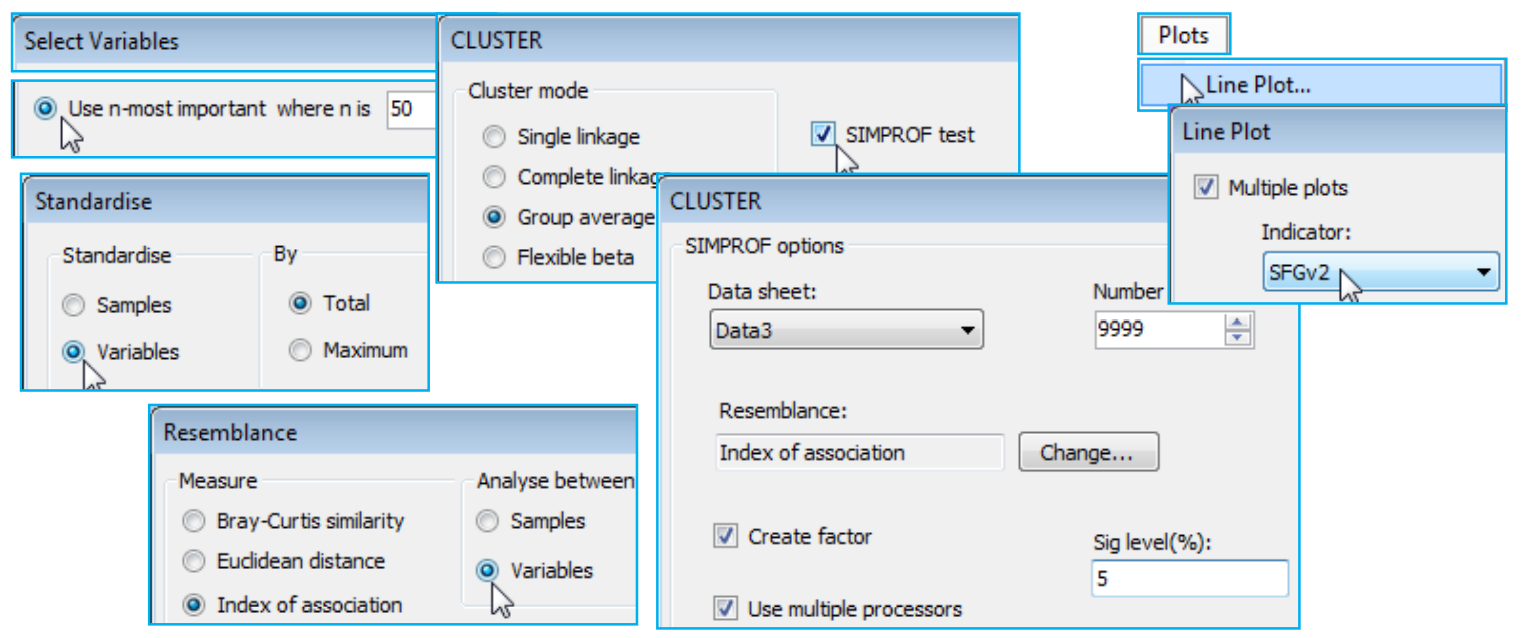
As with the earlier Matrix display, it is instructive therefore to recreate the exact steps of Wizards>Coherence plots by running the component routines. On data Linnhe macrofauna abundance take Select>Variables>(•Use n-most important where n is 50), then run Pre-treatment>Standardise> (Standardise•Variables) & (By•Total), Analyse>Resemblance>(Measure•Index of association) & (Analyse between•Variables), and Analyse>Cluster>CLUSTER>(Cluster mode•Group average) & (✓SIMPROF test) with the default options of Index of Association, a 5% significance level and (Add indicator named: SFGv2). The resemblance matrix and dendrogram structure will be identical to that for the previous run of Coherence plots, but if the SIMPROF groups are not absolutely the same this will be due to the random nature of the permutations and the fact that one of the tests is rather borderline to the 5% significance level, sometimes falling one side and sometimes the other. A larger number of permutations would firm up the true significance level (9999 is preferable if it can run in minutes – actually seconds here) but that does not address the arbitrariness of specifying a 5% significance level for this (or any!) test. The Somerfield & Clarke (2013) paper suggests re-running at 0.1%, 1%, and 5% to see how stable the final groupings are to the choice of level – the more stringent significance levels will produce a smaller (or the same) number of coherent groups. The final step is to run Plots>Line Plot on the (reduced) species-standardised data sheet (probably named Data3), taking (✓Multiple plots)>(Indicator: SFGv2) to recreate the previous MultiPlot1.

