Animating the mMDS/nMDS iterations
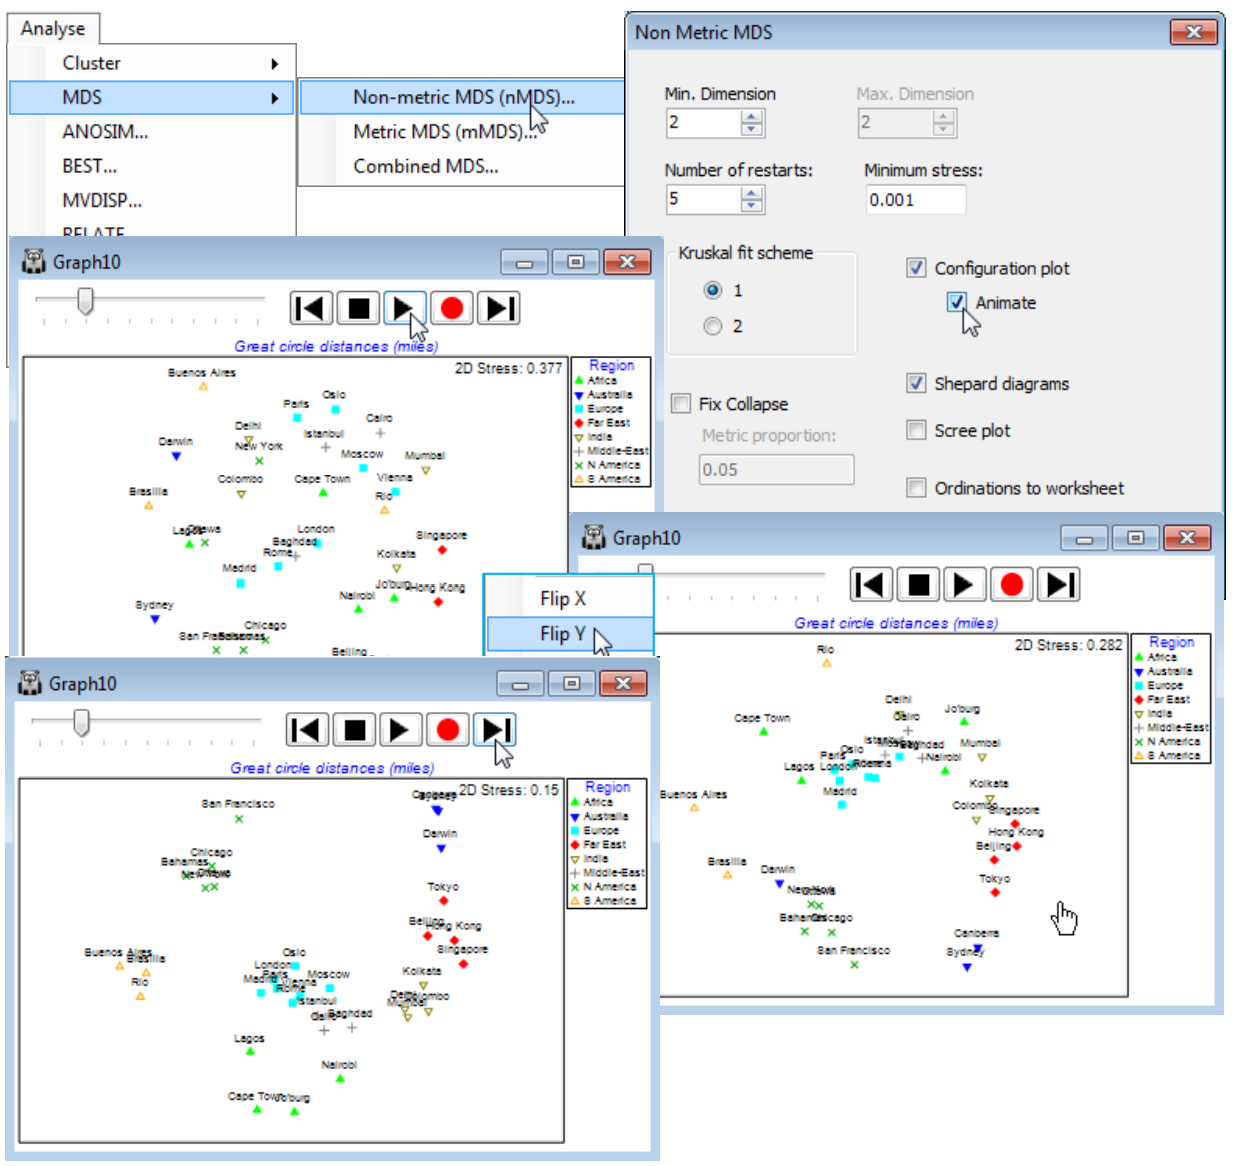
Another feature introduced in PRIMER 7 is more of a teaching tool than an analysis method per se, namely the ability to watch the steps of the MDS iterative process (for either nMDS or mMDS) in converging – or failing to converge! – to an optimal 2- or 3-d representation of the relationships in the resemblance matrix. The option is taken by (✓Configuration plot)>(✓Animate) on the usual MDS dialog. It automatically greys out the (Max. dimension) box so that a single dimension needs to be chosen, via the (Min. dimension) box – for observation, 2 or 3 are the only realistic choices. It is wise, purely for this demonstration process, to reduce to (Number of restarts: 5), say, and to set (Minimum stress: 0.001) so that incremental improvements in stress during the iteration can be seen. On taking OK, the usual animation controls are displayed (as seen earlier in this section for spinning 3-d plots and sequence animations), and the first MDS iteration is started with ![]() .
.
A 2-d nMDS or mMDS of the World city distances provides a useful example for demonstrating the MDS iterative process because of the prior understanding of what a good 2-d solution would look like, so that an iteration which is heading into the cul-de-sac of a local minimum (see Chapter 5 of CiMC) will readily be appreciated. To improve the visual cues, a Region factor is defined, dividing the cities into continental areas with differing coloured symbols. A typical local minimum for this data set would, for example, be when the initial random starting configuration and the early iterative steps separate the African cities into two groups, either side of the denser European-Asian band of points. The routine may then have trouble re-uniting these two groups because any attempt to move African cities through the Europe-Asia axis, by small incremental steps, will be rejected because initially a move in that direction will always increase the stress. In this example, at least 50% of the restarts end up trapped in a local minimum, i.e. converging to a higher stress solution than can be found. Observing such local minima imparts a good appreciation of the importance of increasing the number of restarts routinely run, especially for complex MDS plots.
The speed with which the iterative cycle takes place can be controlled by the slider, and the pause button ![]() is usually necessary to re-orient or flip the axes to a recognisable layout after a grouping of the continents starts to emerge. Initial random configurations have stress values of around 0.4 and occasionally a restart will fail to get going at all but, more typically, stress falls quickly and then slows nearing convergence. At any point, the process can be paused with
is usually necessary to re-orient or flip the axes to a recognisable layout after a grouping of the continents starts to emerge. Initial random configurations have stress values of around 0.4 and occasionally a restart will fail to get going at all but, more typically, stress falls quickly and then slows nearing convergence. At any point, the process can be paused with ![]() and then stepped through incrementally using either of the end controls,
and then stepped through incrementally using either of the end controls, ![]() or
or ![]() . Use of the stop button,
. Use of the stop button, ![]() , is a premature cancellation of the whole run, returning no results. As for previous animations, recording can be started at any point by clicking the record button,
, is a premature cancellation of the whole run, returning no results. As for previous animations, recording can be started at any point by clicking the record button, ![]() , which pauses iteration while details of picture resolution, frames per second and output file name (*.mp4 or animated *.gif) are given. The iteration and recording then restart automatically, and are terminated by
, which pauses iteration while details of picture resolution, frames per second and output file name (*.mp4 or animated *.gif) are given. The iteration and recording then restart automatically, and are terminated by ![]() – in fact recording must always be terminated by this stop control (so ask for more restarts than you plan to record).
– in fact recording must always be terminated by this stop control (so ask for more restarts than you plan to record).

