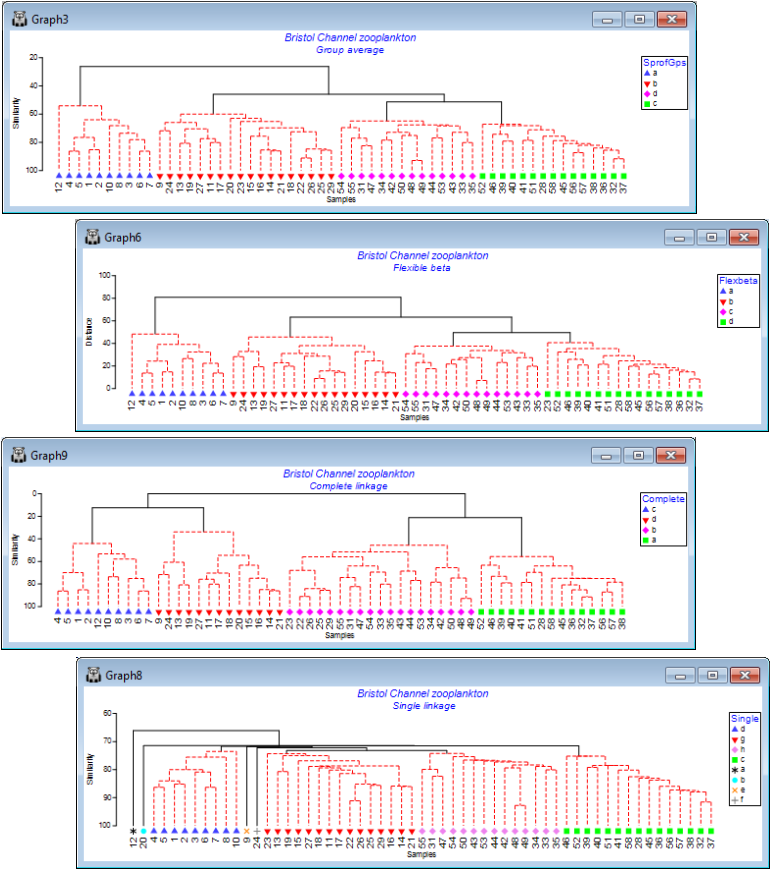
Single and complete linkage
Now re-run Analyse>Cluster>CLUSTER>(Cluster mode•Single linkage), creating the SIMPROF factor Single and run again with (Cluster mode•Complete linkage), giving factor Complete. The respective cophenetic correlations $\rho$ for the four linkage methods are: 0.797 (group average), 0.793 (flexible beta with $\beta$= –0.04), 0.722 (complete linkage) and 0.633 (single linkage). Though it can be difficult visually to compare dendrograms, careful rotation of plots and using Graph>Sample Labels & Symbols to put the respective SIMPROF group factors (SprofGps, Flexbeta, Complete and Single) onto the x axis as symbols shows that: Group average and Flexible beta differ only in the allocation of site 23 between the four SIMPROF groups (they are often similar but the flexible beta method is usually slightly inferior to group average); Complete linkage is similar in that four SIMPROF groups are also defined, though with a sub-cluster of 22, 23, 25, 26, 29 moving between two of these groups (to the detriment of the cophenetic correlation); and Single linkage is the only plot to look substantially different, with clear ‘chaining’ of samples and some singleton SIMPROF groups (sites 9, 12, 20, 24), with a clearly poorer fit ($\rho$= 0.63) to the similarity matrix. (It is often easier to visualise such changes in SIMPROF groups from differing cluster options by indicating those groups as symbols on an MDS ordination. For description of the latter see Section 8 – and for an example of the type of comparative MDS plots suggested see Fig. 3.10 of CiMC).

