(Tikus Is coral cover)
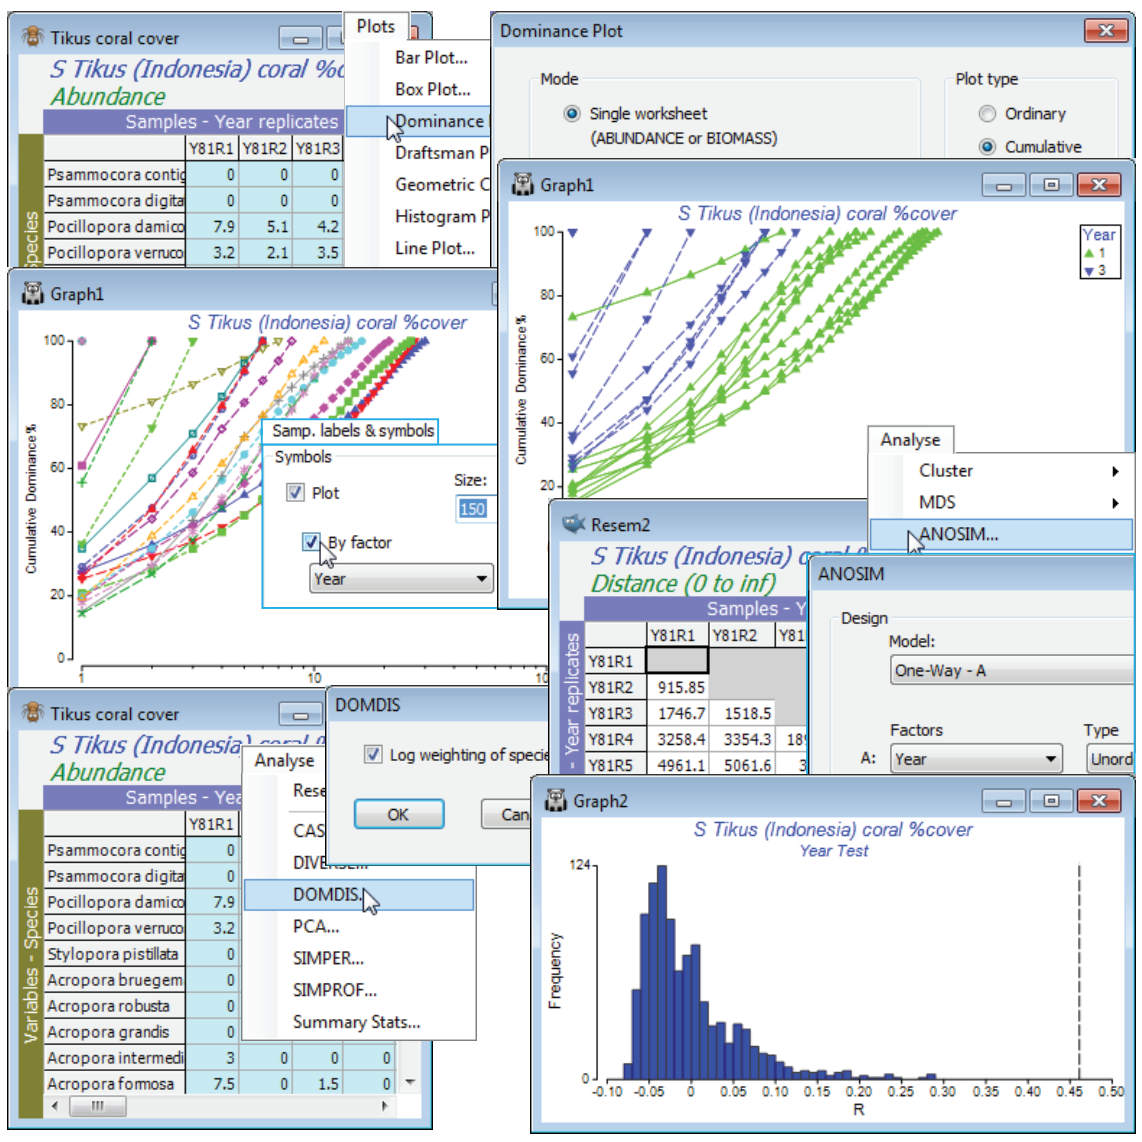
The Tikus Island, Indonesia, data on % area cover of coral communities on 10 transects in the years 1981, 83, 84, 85, 87 and 88, were first met in Section 5, with data sheet Tikus coral cover in the directory C:\Examples v7\Tikus corals. It is discussed extensively in the context of resemblance choice for multivariate analysis in Chapter 16 of CiMC but here, as an illustration of k-dominance curve testing, we will use only the differences between two of the years: 1981 and 1983, before and after the major El Niño event of 1982/3.
Open Tikus coral cover in a new workspace and Select>Samples>(•Factor levels)>(Factor name: Year)>Levels and Include only 1 and 3. Plots>Dominance Plot, with the defaults of (Mode•Single worksheet) and (Plot type•Cumulative), will generate the k-dominance curves for all the selected samples on a single plot. Show the group structure of 10 replicates from each of two years by Graph>Sample Labels & Symbols, switching on (Symbols:✓Plot>✓By factor: Year). To test for significance of the (rather obvious!) differences between the curves in the two years, run Analyse>DOMDIS>(✓Log weighting of species ranks) on Tikus coral cover. This generates a resemblance matrix Resem1, giving the distance between all pairs of curves, which is then input to Analyse>ANOSIM>(Model: One way - A)>(Factors A: Year)>(Type: Unordered), with the other defaults taken. The R statistic is 0.46, easily larger than for any of the 999 random permutations under the hypothesis of no year difference, thus p<0.1% (and the null histogram shows it would be a great deal smaller, for more simulations), signifying a clear change in dominance pattern between the years. The R value is depressed somewhat by one outlying replicate in 1981 which is much more dominated, and less species rich, than the other 9 transects, but there is no justification for leaving it out of the analysis. Close the workspace – it will not be needed again.

