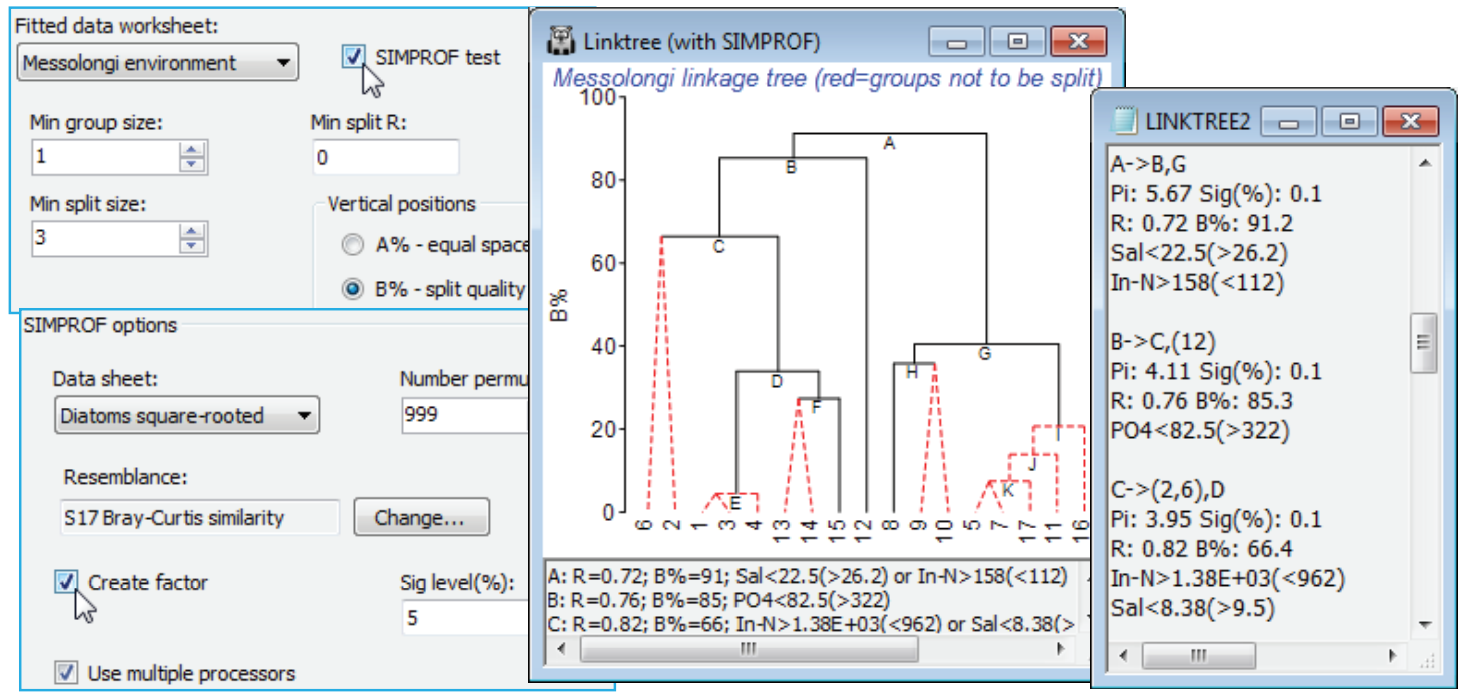
SIMPROF test in LINKTREE
Low values of B% correspond to samples which are rather close together on the MDS plot and the question naturally arises as to whether these samples should be split at all – is there any evidence that the biological assemblages differ among the sites 5, 7, 11, 16, 17? If not, then we should not be seeking an environmental variable which distinguishes two subgroups within them. The SIMPROF test (Section 6) answers this question and provides a statistical basis for interpretation of a further subdivision. The test is the same as used with the unconstrained cluster analyses of Section 6 – the real profile of the biotic resemblances, in rank order, is compared with many repeated profiles from randomly permuting species values across these 5 samples, separately for each species. The test statistic $\pi$ measures departure of the real profile from the mean of the random profiles, and this is set against the range of values it takes for the deviation of (further) random profiles from this mean. A large real $\pi$ implies significance, e.g. if it is larger than all but 49 of the 999 random profiles then homogeneity of the assemblages in this group would be rejected at p$\le$5%, and it is justifiable to interpret the next division LINKTREE makes – the text pane and results window continue to list all divisions permitted by the other stopping rules but the tree branches in red are not significant and it would be unwise to interpret those splits. The results window gives SIMPROF $\pi$ and p values and a factor is created of the SIMPROF groups which can be used to show those groups on an MDS, say.
Run Analyse>Cluster>LINKTREE as before on the diatom resemblances, this time taking (Min split size: 3) so this criterion does not enter – remember SIMPROF can never split a group of two – and (Vertical positions•B%) & (✓SIMPROF test). Look at the entries on the SIMPROF options dialog, but you will probably not need to change any. Since the test is on the biotic data not the environmental, the program steps back in the Explorer tree to find the default (Data sheet: Diatoms square-rooted) whose rows are to be permuted, and the (Resemblance:) specified will be the one used for the active matrix (Bray-Curtis here). You may need to reduce the number of permutations for much larger data problems (this intensive routine exploits available multi-core processing) or just run LINKTREE without SIMPROF tests, and do some selective tests on a few key splits with Analyse>SIMPROF on these selections in Diatoms square-rooted. The plot here shows that (5,7, 11,16,17) do not differ ($\pi \approx$0.95, p<35%) but (1,3,4,13-15) do differ ($\pi \approx$2.3, p<1%) and are split into three interpretable groups. Note also the uneven steps (large and small group differences) in the B% scale, which is now comparable across branches, unlike the equi-spaced A% scale.

