Histograms for one sublist size
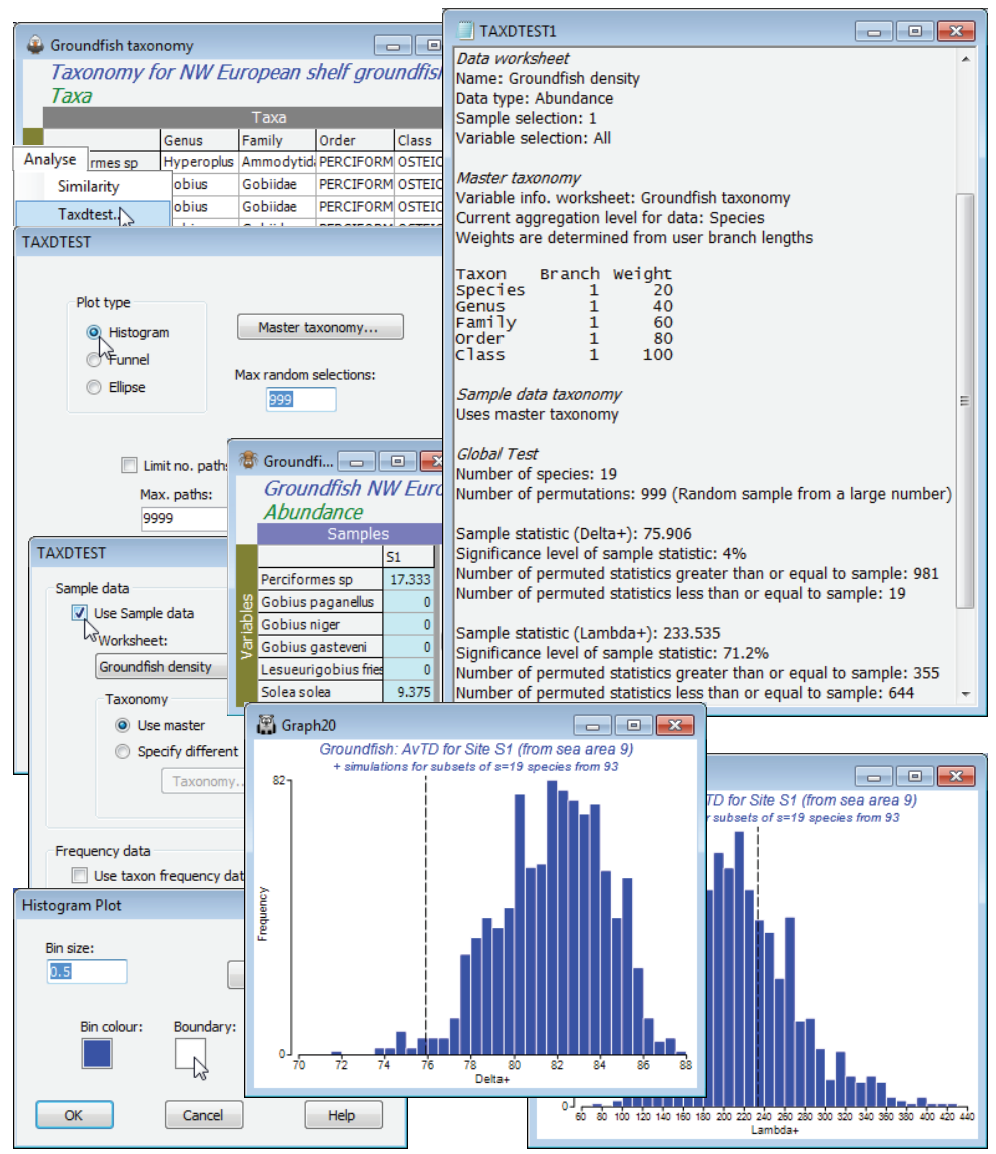
For an example, take the first of the 277 groundfish samples, the 0.25$^\circ$ rectangle S1. Highlight and select just this column from Groundfish density, with Select>Highlighted (this is a quantitative matrix not presence/absence, but TAXDTEST will automatically convert it to P/A data – as does DIVERSE when computing $\Delta^{\scriptscriptstyle +}$, $\Lambda^{\scriptscriptstyle +}$ etc.). With the Groundfish taxonomy sheet as active window, run Analyse>TAXDTEST>(Plot type•Histogram) & (Max random selections: 999), with defaults for the Master taxonomy button and, on the next screen, check (Sample data✓Use Sample data)> (Worksheet: Groundfish density)>(Taxonomy• Use master). Leave the (Frequency data) section for now – it will be demonstrated later. The routine counts S = 19 species in the supplied sample data column so produces 1000 random draws of 19 species from the master list, Groundfish taxonomy. It then calculates $\Delta^{\scriptscriptstyle +}$ and $\Lambda^{\scriptscriptstyle +}$ for each random draw and puts the values into a histogram for each index. The real values of $\Delta^{\scriptscriptstyle +}$ and $\Lambda^{\scriptscriptstyle +}$ for that data column are shown by a dashed line, as usual, and the significance levels (here, for a two-sided test) are given in the results window. In this case, only 19 of the 999 random draws gave $\Delta^{\scriptscriptstyle +}$ values less than or equal to the real $\Delta^{\scriptscriptstyle +}$. The probability of this under the null hypothesis (that species at that S1 location are representative of the full taxonomic spread in the master list of 93, so retain the overall biodiversity) is $\le$(19+1)/(999+1) = 0.02, i.e. a significance level of $\le$2% on a one-sided test. It is arguable here that the test should be one-sided, and that the only departure of interest from the null is one of decreasing taxonomic distinctness – perhaps through extensive beam-trawling differentially affecting groups of groundfish higher taxa with particular life-history characteristics. There may, however, be situations in which we would like also to be able to detect increases in $\Delta^{\scriptscriptstyle +}$, and it is certainly true for $\Lambda^{\scriptscriptstyle +}$ that plausible alternatives to the null hypothesis could be two-sided. So PRIMER quotes two-sided significance levels in both cases (thus a significance of 4.0% for $\Delta^{\scriptscriptstyle +}$) – a one-sided test would simply halve the quoted values. Also remember that each run will give slightly different results because of different random draws, and in borderline cases you might want to increase the number of random draws, e.g. to 9999.
The histograms are displayed in a multiplot, with just the two component plots. The usual display options are accessed through the Graph>General menu, to change overall font size, titles etc., and Graph>Special has here allowed the bin size to be increased for a smoother histogram, and can allow colour change of the histogram bars and boundary (the latter from black to white here).
If you submit several columns of data by mistake at this stage, the error message Only one sample must be selected for histogram will result. If you wish to generate histograms of expected $\Delta^{\scriptscriptstyle +}$ (or $\Lambda^{\scriptscriptstyle +}$) values from the master list, for a fixed sample size (e.g. S = 20), without referring to a specific data sample, then uncheck (✓Use Sample data) in the TAXDTEST dialog. You will then be asked to supply that size, e.g. Histogram>S value (no sample data): 20.

