0.3 Introduction to the methods of PERMANOVA+
Rationale
PERMANOVA+ is an add-on package which extends the resemblance-based methods of PRIMER to allow the analysis of multivariate (or univariate) data in the context of more complex sampling structures, experimental designs and models. The primary reasons that the methods currently available in the PRIMER package (such as ANOSIM and MDS) have become so widely used for the analysis of multivariate ecological (and other) data are their general robustness and flexibility. They are flexible due to their reliance, at heart, on a resemblance measure (a distance, dissimilarity or similarity), of which there are many to choose from, each with its own emphasis and properties. They are robust because, unlike traditional multivariate statistical methods, they make no explicit assumptions regarding the distributions of original variables, acting primarily only on the ranks of dissimilarities, and with any hypothesis-testing procedures (such as ANOSIM) using permutations to obtain P-values. The philosophy underlying the methods in PRIMER, as articulated by Clarke & Green (1988) and Clarke (1993) , is to maintain this purely non-parametric rank-based approach throughout. This is generally highly appropriate, because most ecological data (being counts or other measures of abundances of species) tend to be overdispersed, with heavily right-skewed distributions ( Taylor (1961) , Seber (1982) , McArdle, Gaston & Lawton (1990) ) and a plethora of zeros ( Welsh, Cunningham, Donnelly et al. (1996) , Fletcher, Mackenzie & Villouta (2005) ). Also, the number of variables (usually species or taxa) often far exceeds the number of sampling units (quadrats, cores, transects, etc.), making traditional statistical approaches either problematic or simply impossible (e.g., as in MANOVA). Even if the number of variables does not exceed the number of samples, traditional MANOVA (unlike univariate ANOVA) is not robust to violations of its assumptions, especially multivariate normality (e.g., Mardia (1971) , Olson (1974) , Johnson & Field (1993) ).
By taking a purely non-parametric approach, however, one must also accept certain limitations. Perhaps the most important of these is the lack of any ability to partition the multivariate variation according to more complex experimental designs. More particularly, a purely non-parametric approach precludes us from: (i) partitioning variability according to one or more explanatory variables or factors; (ii) measuring or testing interactions among factors (which can only be defined by reference to main effects that have been modelled in some way); and (iii) developing explicitly quantitative models with any explanatory, discriminatory or predictive uses. Most ecological experiments, whether they be mensurative or manipulative (sensu Hurlbert (1984) ), do have complex sampling structures, with multiple hierarchical spatial and/or temporal scales. Few scientists embark on experiments having only one factor; experimental designs with more than one factor, including interactions, are far more common, being more efficient, informative and relevant ( Underwood (1981) , Underwood (1997) ). In addition, tests of interactions are used to examine the generality of phenomena (in time or space, e.g., Snedecor (1946) , Beck (1997) ) and to assess environmental impact with rigour (e.g., Green (1979) , Underwood (1991) , Underwood (1992) ).
The purpose of the routines provided in the PERMANOVA+ add-on package is to maintain as much of the flexibility and robustness inherent in the methods offered by PRIMER as possible, yet to achieve the partitioning required to analyse more complex designs and to develop multivariate models. In essence, the methods in PERMANOVA+ allow multivariate data to be modelled, analysed and tested on the basis of any resemblance measure of choice, and all tests of hypotheses are done using permutation techniques1. The methods offered as part of the PERMANOVA+ add-on package do not in any way replace the existing methods in PRIMER, but rather, they provide a complementary set of tools for more complex designs and modelling. Unfortunately, you can’t get something for nothing, and so in order to take this step of partitioning, we must articulate what we mean by “variation” and, in so doing, give up the “purely non-parametric” label. In other words, we will allow the actual values in the resemblance matrix to take on meaning; they will not be replaced by their relative ranks; we will allow the chosen resemblance measure for a given analysis to dictate what we mean by “multivariate variability”. This is not too much of a tragedy, as we do still retain great flexibility (because we can still choose any resemblance measure we wish) and robustness (because permutation methods are being used)2. What it does mean, however, is that we will need to think carefully about the meaning of the resemblance measure we do choose to use (including any transformations) as this choice will play an even more important role in the analysis than is the case in other PRIMER routines.
Application
As in PRIMER, the focus of PERMANOVA+ is generally on the analysis of ecological data, especially counts of species abundances. In addition, many of the data sets and examples are from ecology, particularly from marine or estuarine ecosystems, due to the origins of the methods arising from these contexts. However, the methods themselves are not limited, and may be applied to any situation where one wishes to analyse either univariate or multivariate data in response to either simple or complex experimental designs or models. The methods are particularly suited to the analysis of data which do not fulfil the assumptions of traditional statistical approaches because they have too many response variables, or because one or more response variables are not normally distributed. In general, the only requirement of the permutation-based techniques in any of these routines is that either the samples (observation units) themselves or the errors under a particular model be exchangeable under an appropriate null hypothesis.
A search of the ISI database of articles that have cited some of the core methods papers (e.g., Anderson (2001a) , McArdle & Anderson (2001) , Anderson & Willis (2003) ) gives a good indication of the types and variety of recent applications of these techniques. They include not only ecological examples from marine, freshwater and terrestrial environments, but also examples from diverse disciplines such as zoology (e.g., Pertoldi, Garcia-Perea, Godoy et al. (2006) ), soil science (e.g., Hoyle & Murphy (2006) ), genetics (e.g., Wessel & Schork (2006) ), psychology (e.g., Wheldon, Anderson & Johnson (2007) ) and physiology (e.g., Hepner, Homewood & Taylor (2002) ).
Individual details for each method are given in separate chapters, but as a general point of interest, when the methods are applied to a Euclidean distance matrix, they are equivalent to their traditional statistical counterparts (e.g., ANOVA, regression, PCA, RDA, discriminant analysis, etc.). This means that any data set for which a traditional statistical method would be appropriate can be analysed using the routines in PERMANOVA+, but with more robust statistical inferences provided by virtue of the use of permutations, rather than tables, to obtain P-values.
Outline of routines
Virtually all of the methods provided in the PERMANOVA+ add-on package for PRIMER begin with the resemblance matrix. The first time the user opens up PRIMER after installation of the add-on, a new menu item will appear (Fig. B.1), called PERMANOVA+, from which all of the individual routines can be accessed once a resemblance matrix has been either imported or created within PRIMER.
The individual routines are:
PERMANOVA, for the analysis of univariate or multivariate data in response to factors, groups or treatments in an experimental design;
PERMDISP, to measure and test homogeneity of multivariate dispersions among a priori groups;
PCO, to provide an unconstrained ordination of multivariate data on the basis of a chosen resemblance measure;
DISTLM, for the analysis of univariate or multivariate data in response to continuous (or categorical) predictor variables (such as environmental variables), a distance-based regression approach, with various options for model selection;
dbRDA, for the ordination and visualisation of fitted models (such as from DISTLM); and
CAP, to use multivariate data to discriminate among a priori groups or to predict values along a gradient; also to do distance-based canonical correlation.
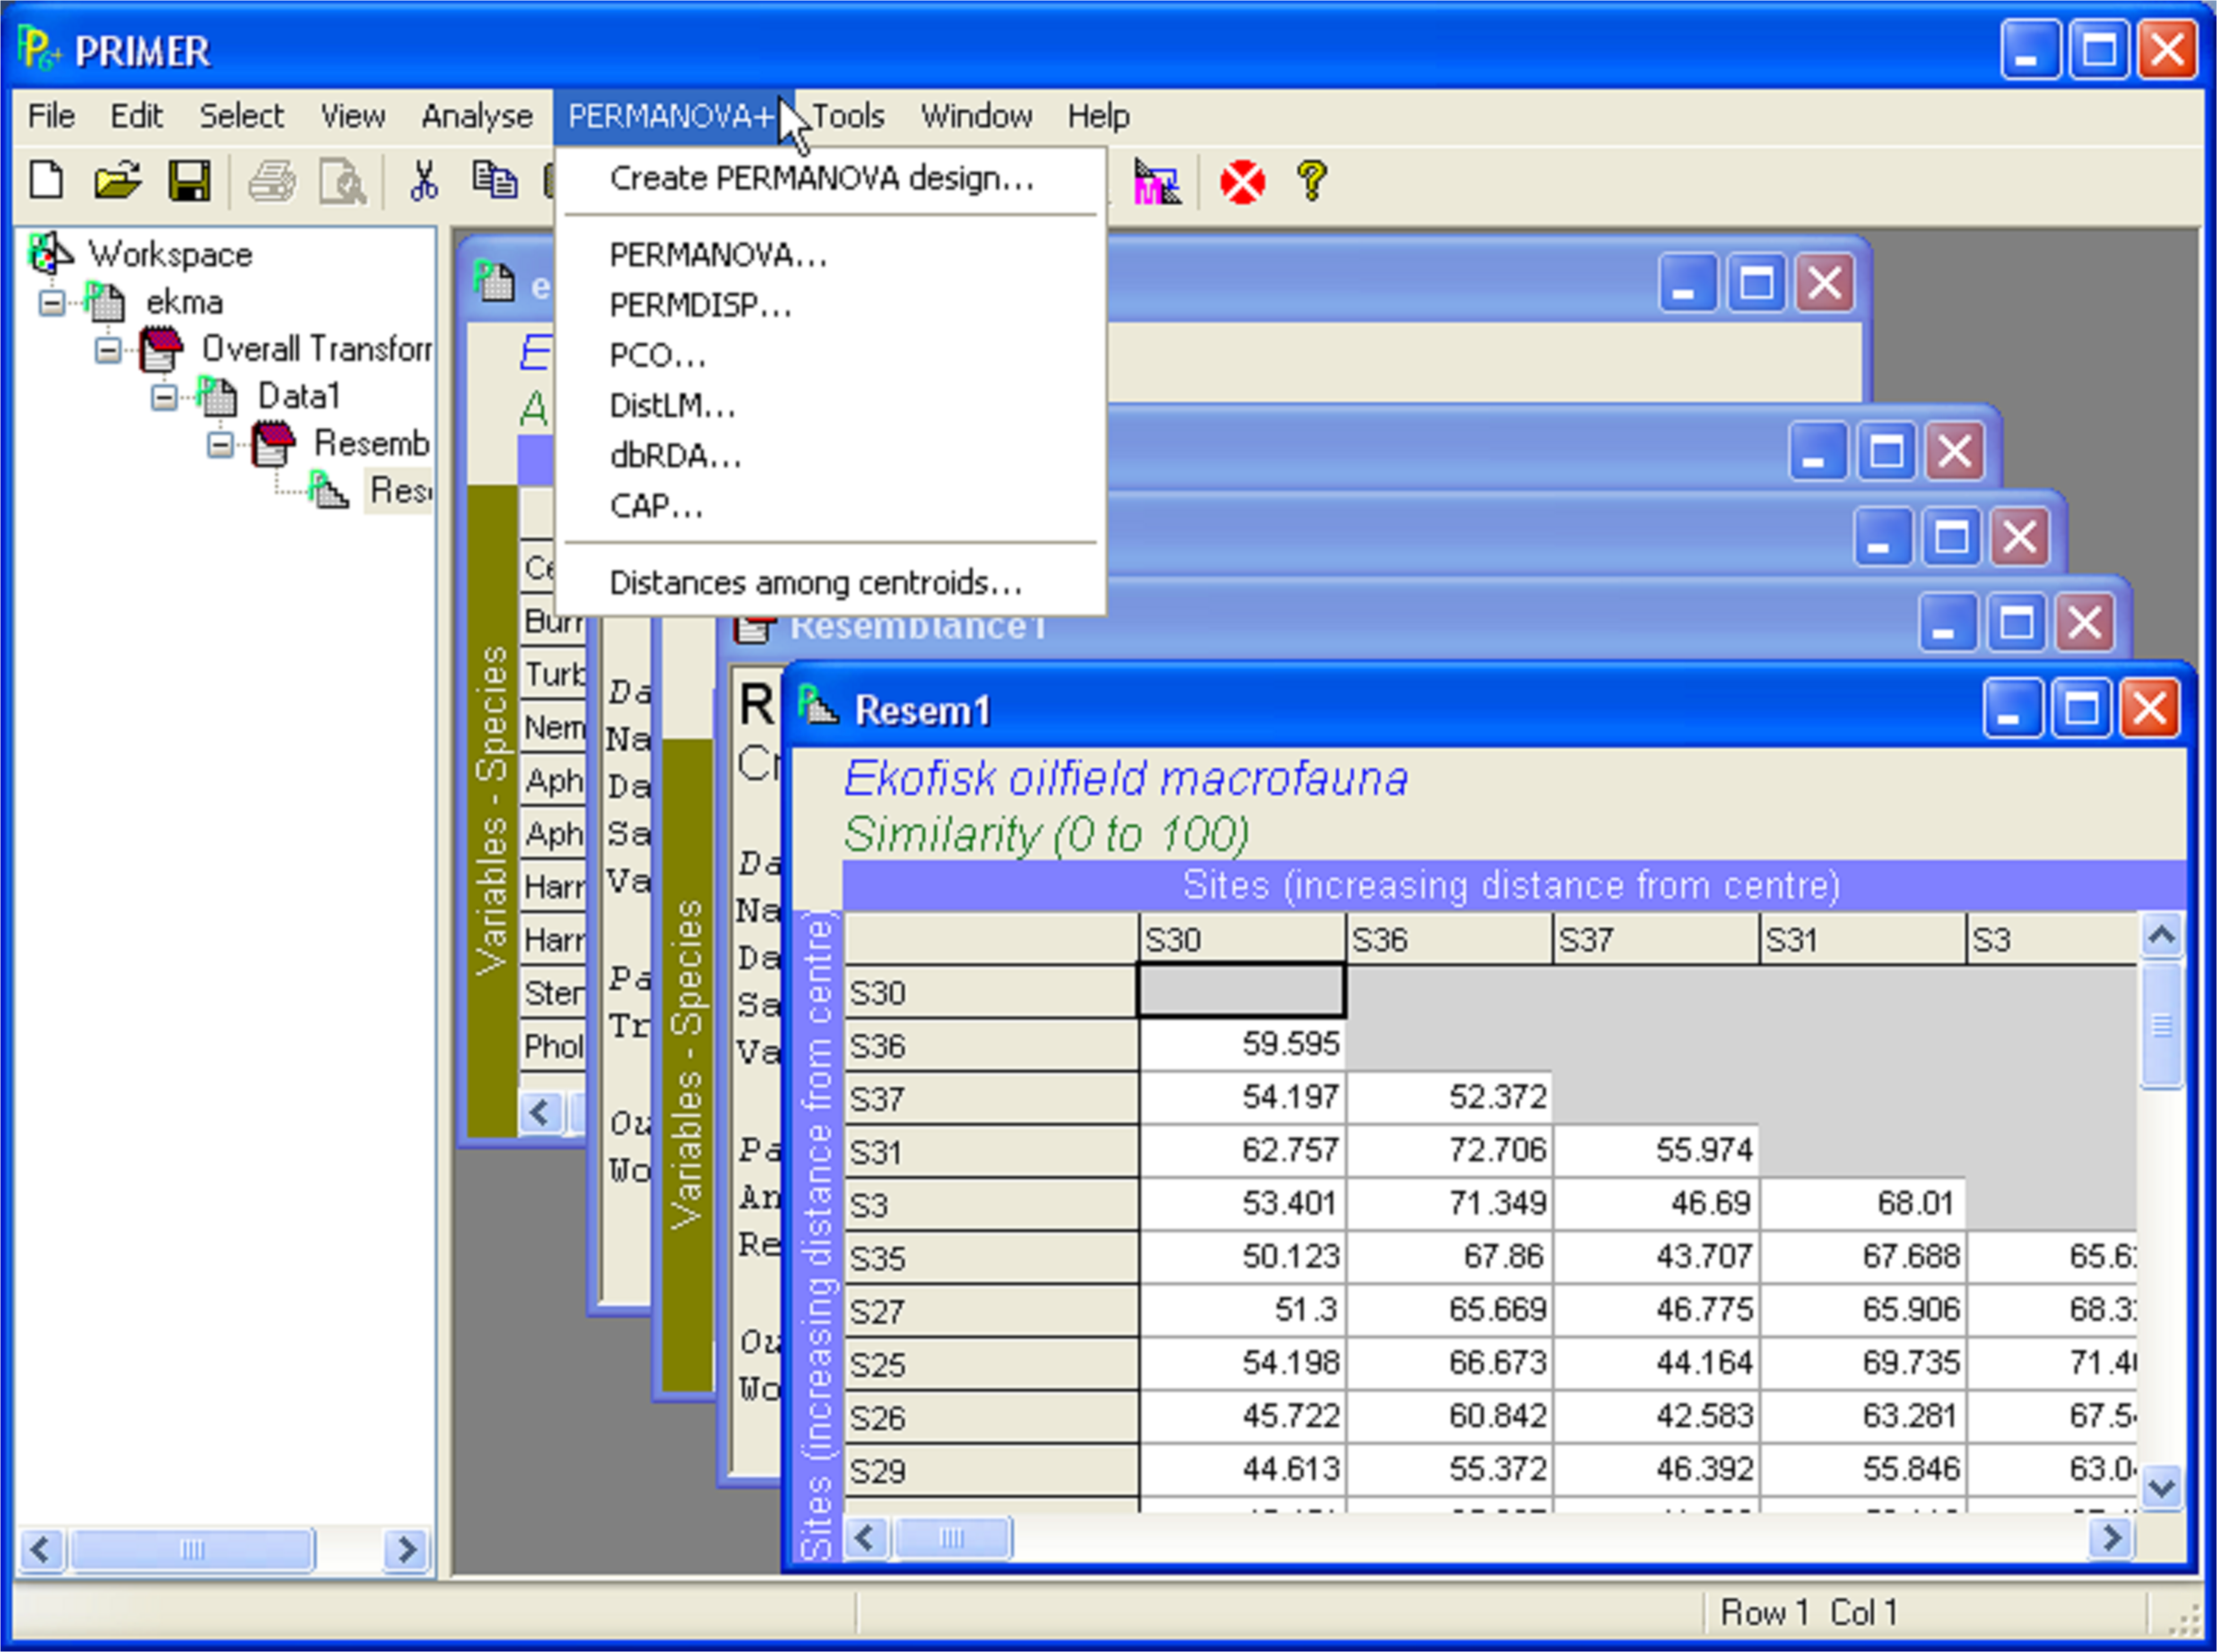 Fig. B.1. The new menu item for the PERMANOVA+ add-on to PRIMER v6.
Fig. B.2 shows a schematic diagram and flowchart of the routines in the context of their use. Alongside each method (inside an oval shape) is also shown the corresponding traditional statistical method that would be obtained in the event that the resemblance matrix used to begin with contained Euclidean distances. The diagram does not show all of the many other routines available from within PRIMER, which are well described elsewhere (
Clarke & Gorley (2006)
). Many of these may be used in combination with the routines offered in PERMANOVA+. For example, in the absence of a priori groups, PRIMER routines such as CLUSTER and the associated SIMPROF tests may be appropriate, and the use of exploratory tools, such as draftsman plots, to examine distributions and potential multicollinearity among predictor variables, are also highly recommended before proceeding with modelling (Fig. B.2).
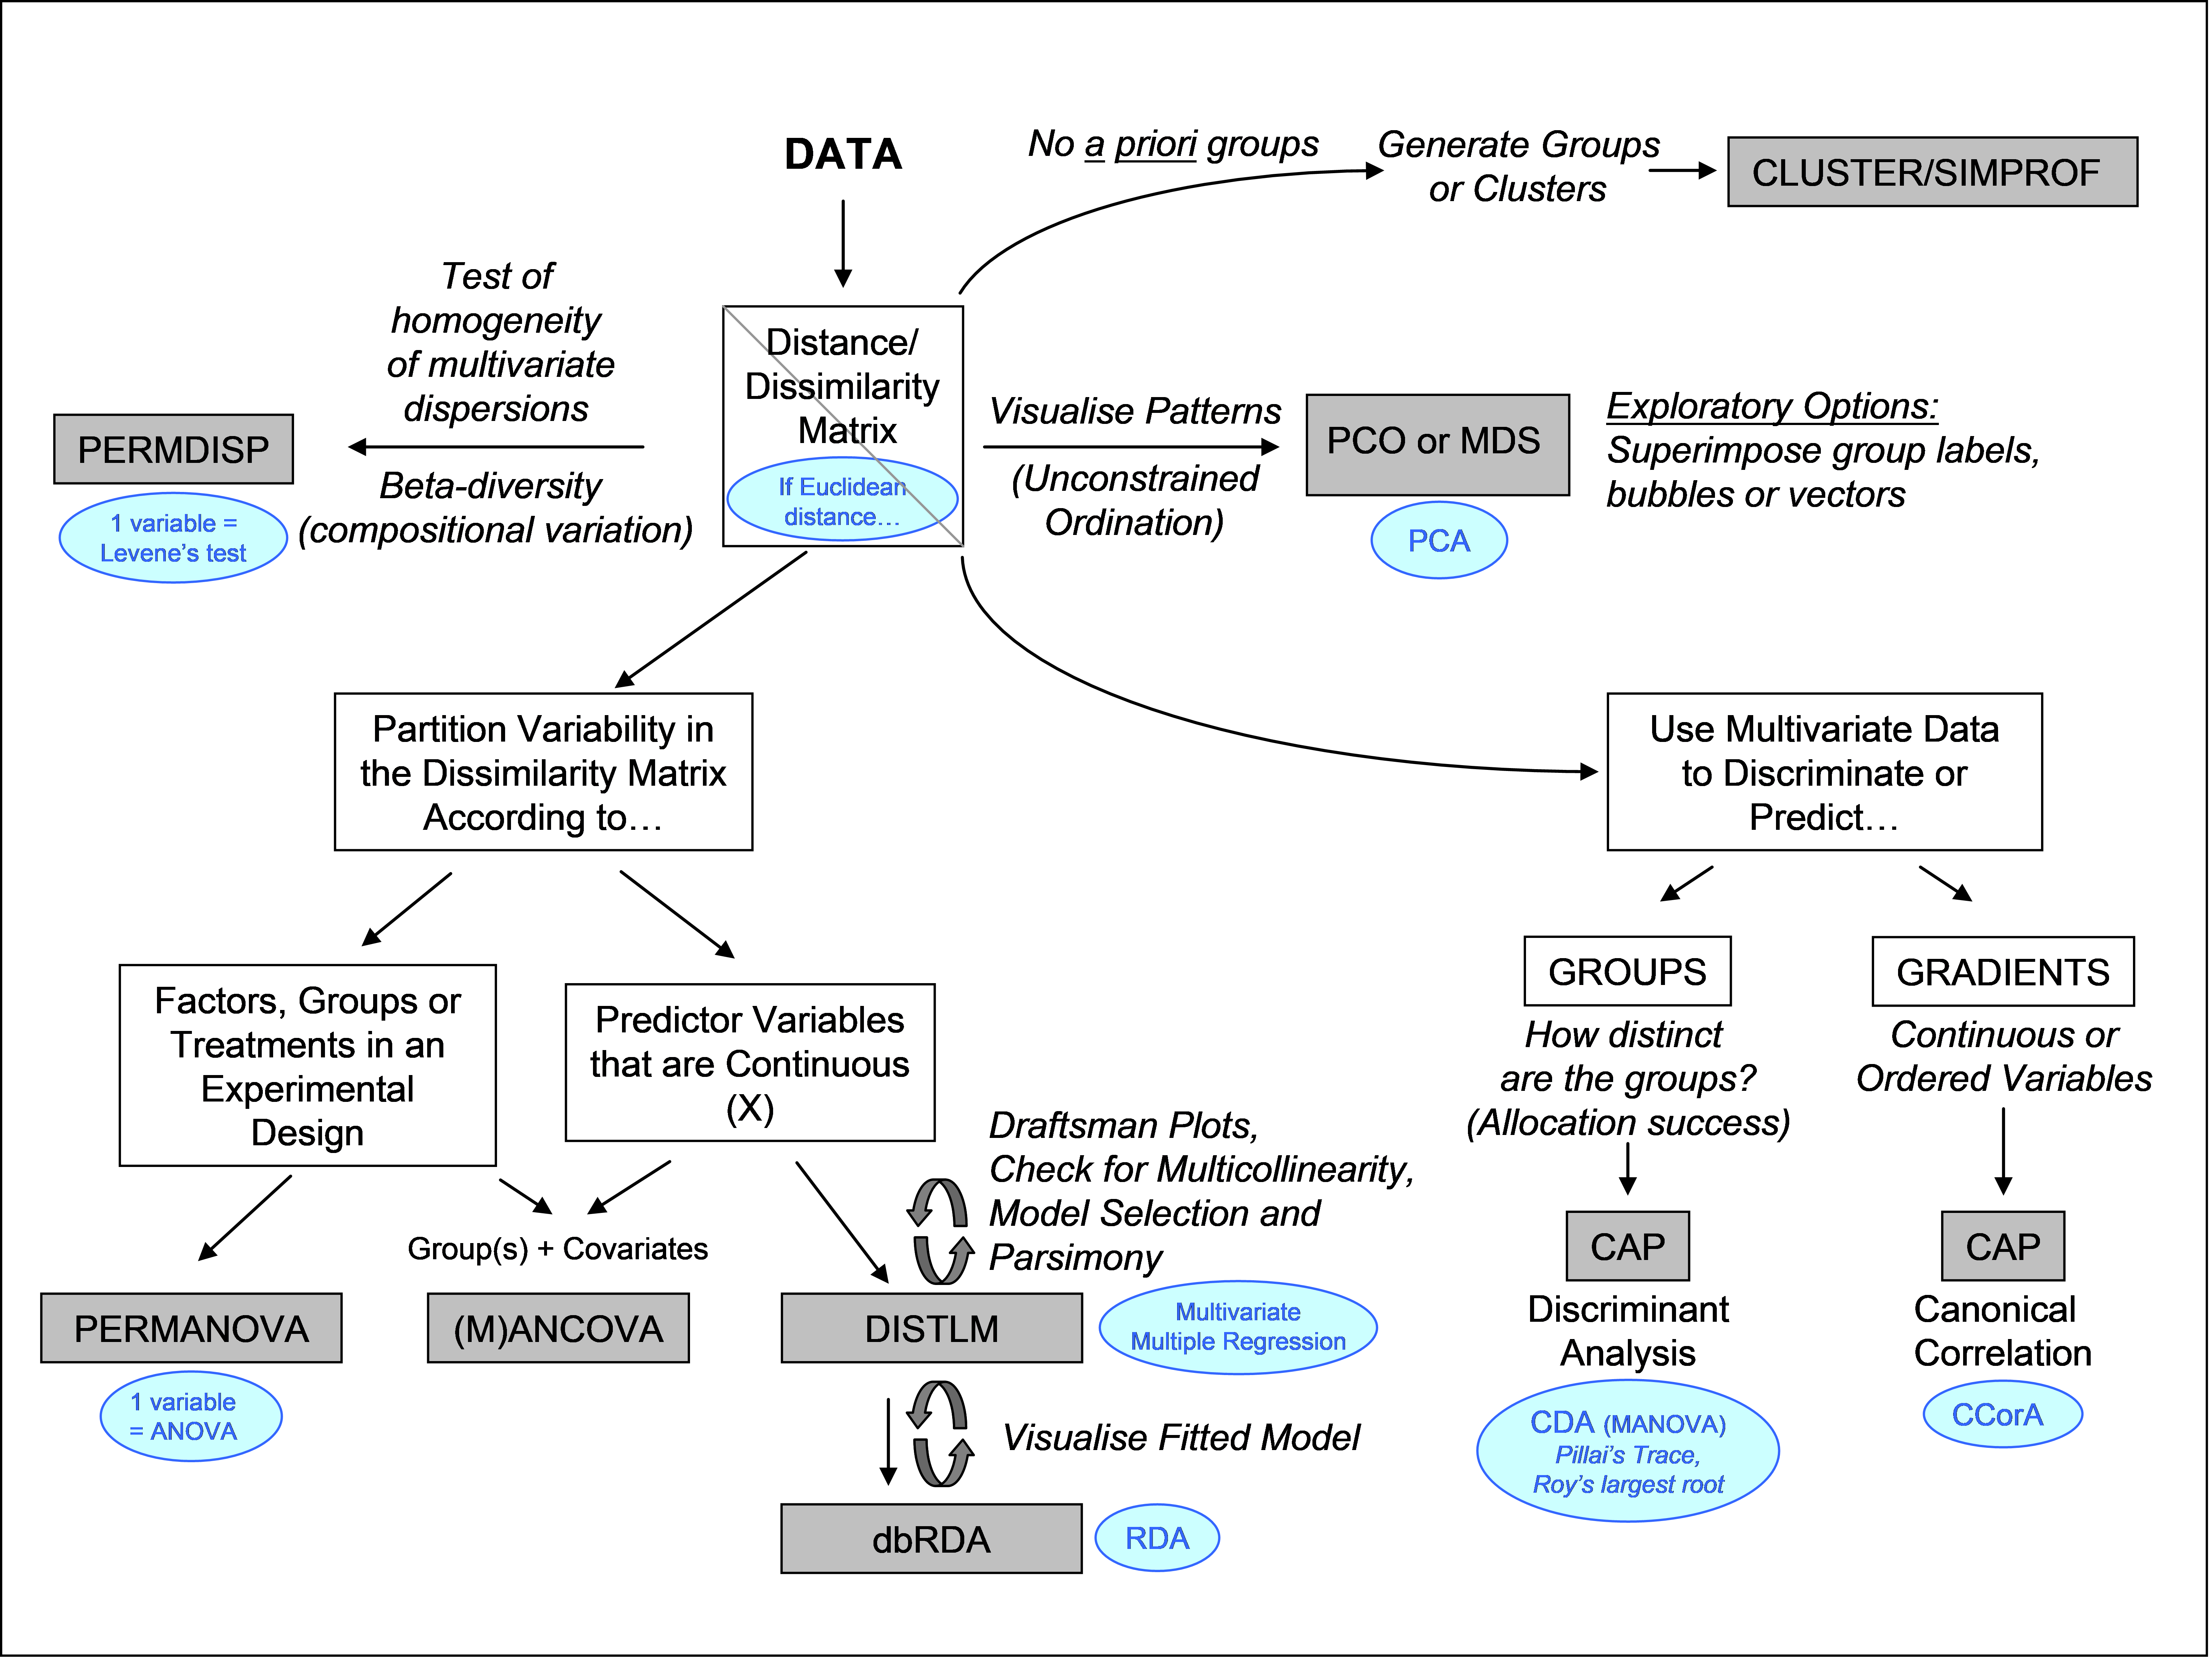 Fig. B.2. Schematic flowchart showing the methods in PERMANOVA+ and their traditional counterparts (in ovals), obtained if Euclidean distances are used.
1 Exceptions to this include: (i) the option to do Monte Carlo sampling from an asymptotic permutation distribution, in the event of there being too few possible permutations for a meaningful test in PERMANOVA and (ii) the option to use tabled F distributions in PERMDISP.
2 Although the methods offered by the PERMANOVA+ package may not be purely non-parametric, they still make no explicit assumptions regarding either the distribution of the original variables or of the resemblance values themselves, as a consequence of their use of permutation techniques. The methods may be considered, therefore, to be “semi-parametric” in some sense.