2.7 Ecological example (Tikus Island corals)
An ecological example of the test for homogeneity is provided by considering a study by Warwick, Clarke & Suharsono (1990) on coral assemblages from South Tikus Island, Indonesia. Percentage cover was measured along 10 transects for 75 species of coral in each of several years (1981-1988) which spanned an El Niño weather event occurring in 1982-83. For simplicity, we shall consider here only the years 1981, 1983 and 1985. The data are located in the file tick.pri in the ‘Corals’ folder of the ‘Examples v6’ directory for PRIMER. Open up the file in PRIMER and select only the years 81, 83 and 85 from the dialog box obtained by choosing Select > Samples > •Factor levels > Factor name: Year and clicking on the ‘Levels’ button and picking out these years. An MDS plot of these samples on the basis of the Bray-Curtis measure (Fig. 2.5) shows a clear pattern of apparently much greater dispersion (variability) among the samples obtained in 1983, right after the El Niño event, with relatively less dispersion among samples obtained either before (1981) or two years after (1985).
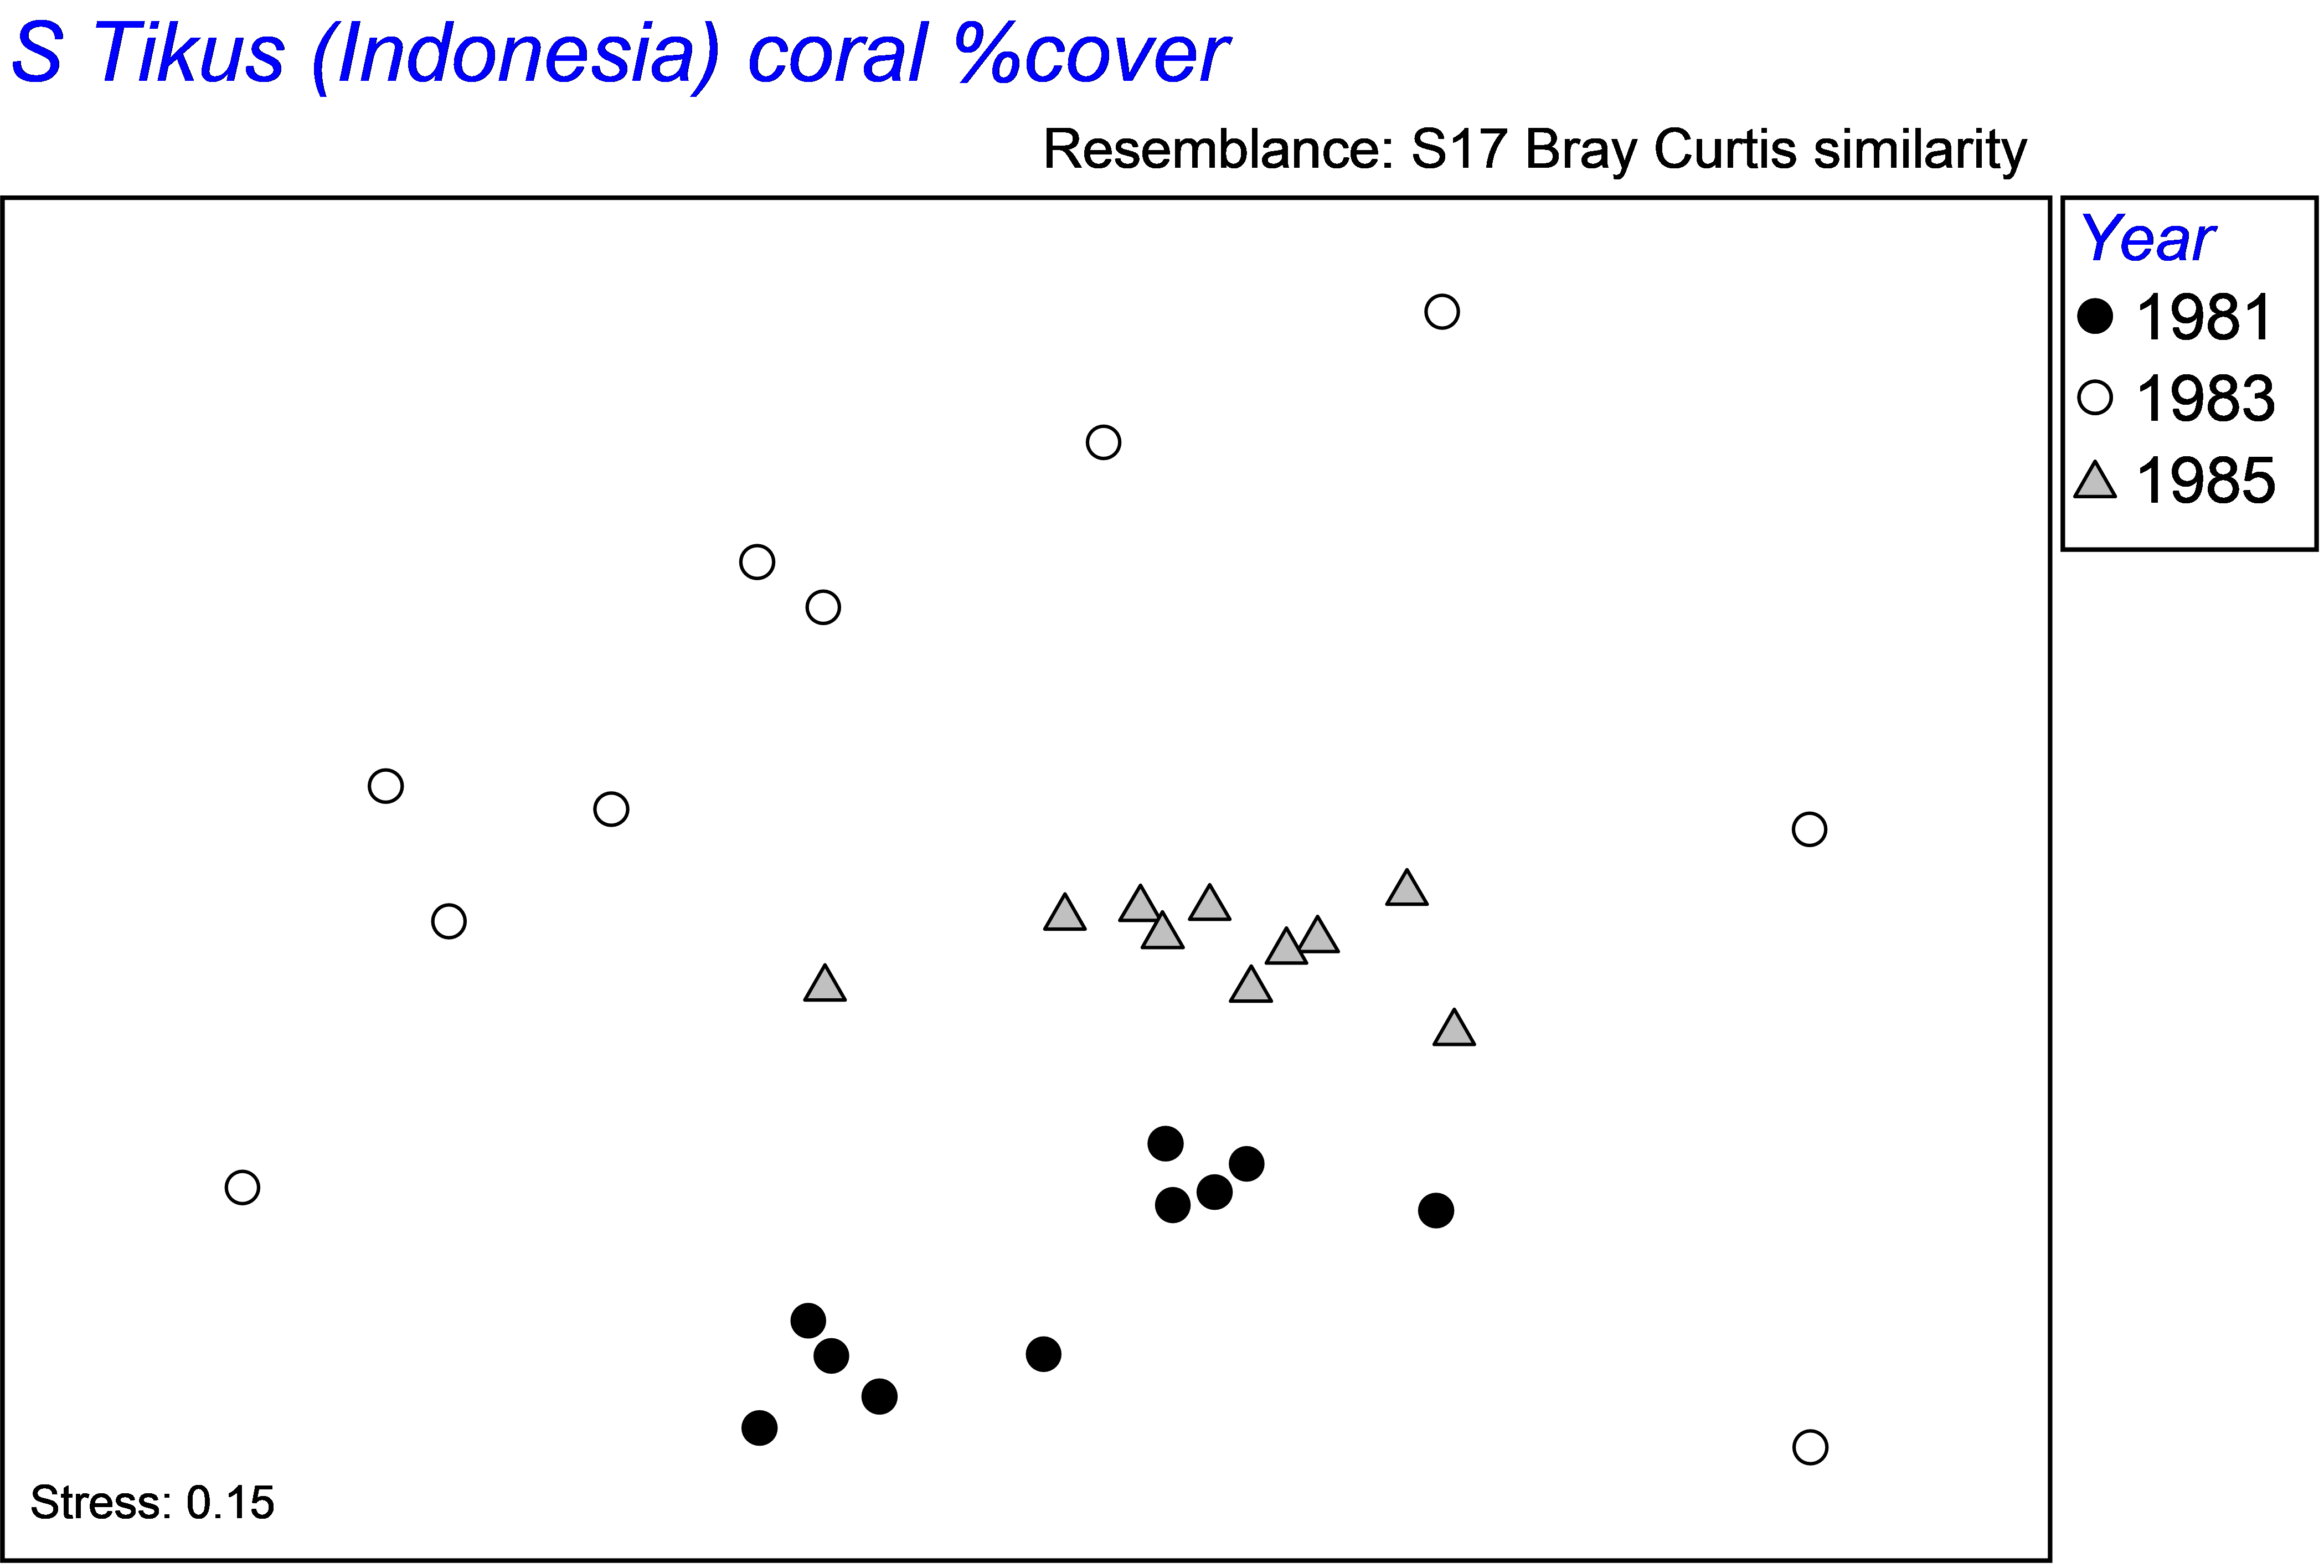
Fig. 2.5. MDS of coral assemblages from South Tikus Island in each of three years based on Bray-Curtis.
To perform the test for homogeneity of dispersions for these data (Fig. 2.6), click on the resemblance matrix and choose PERMANOVA+ > PERMDISP > (Group factor: Year) & (Distances are to •Centroids) & (P-values are from •Permutation) & (Num. permutations: 9999) & ($\checkmark$Do pairwise tests). Not surprisingly, the overall test comparing all three groups is highly statistically significant (Fig. 2.6). Individual pairwise tests show that there was no significant difference in dispersion between 1981 and 1985, but that the dispersion of assemblages for 1983 was significantly larger than either of these, having an average Bray-Curtis distance-to-centroid of over 62% (Fig. 2.6).
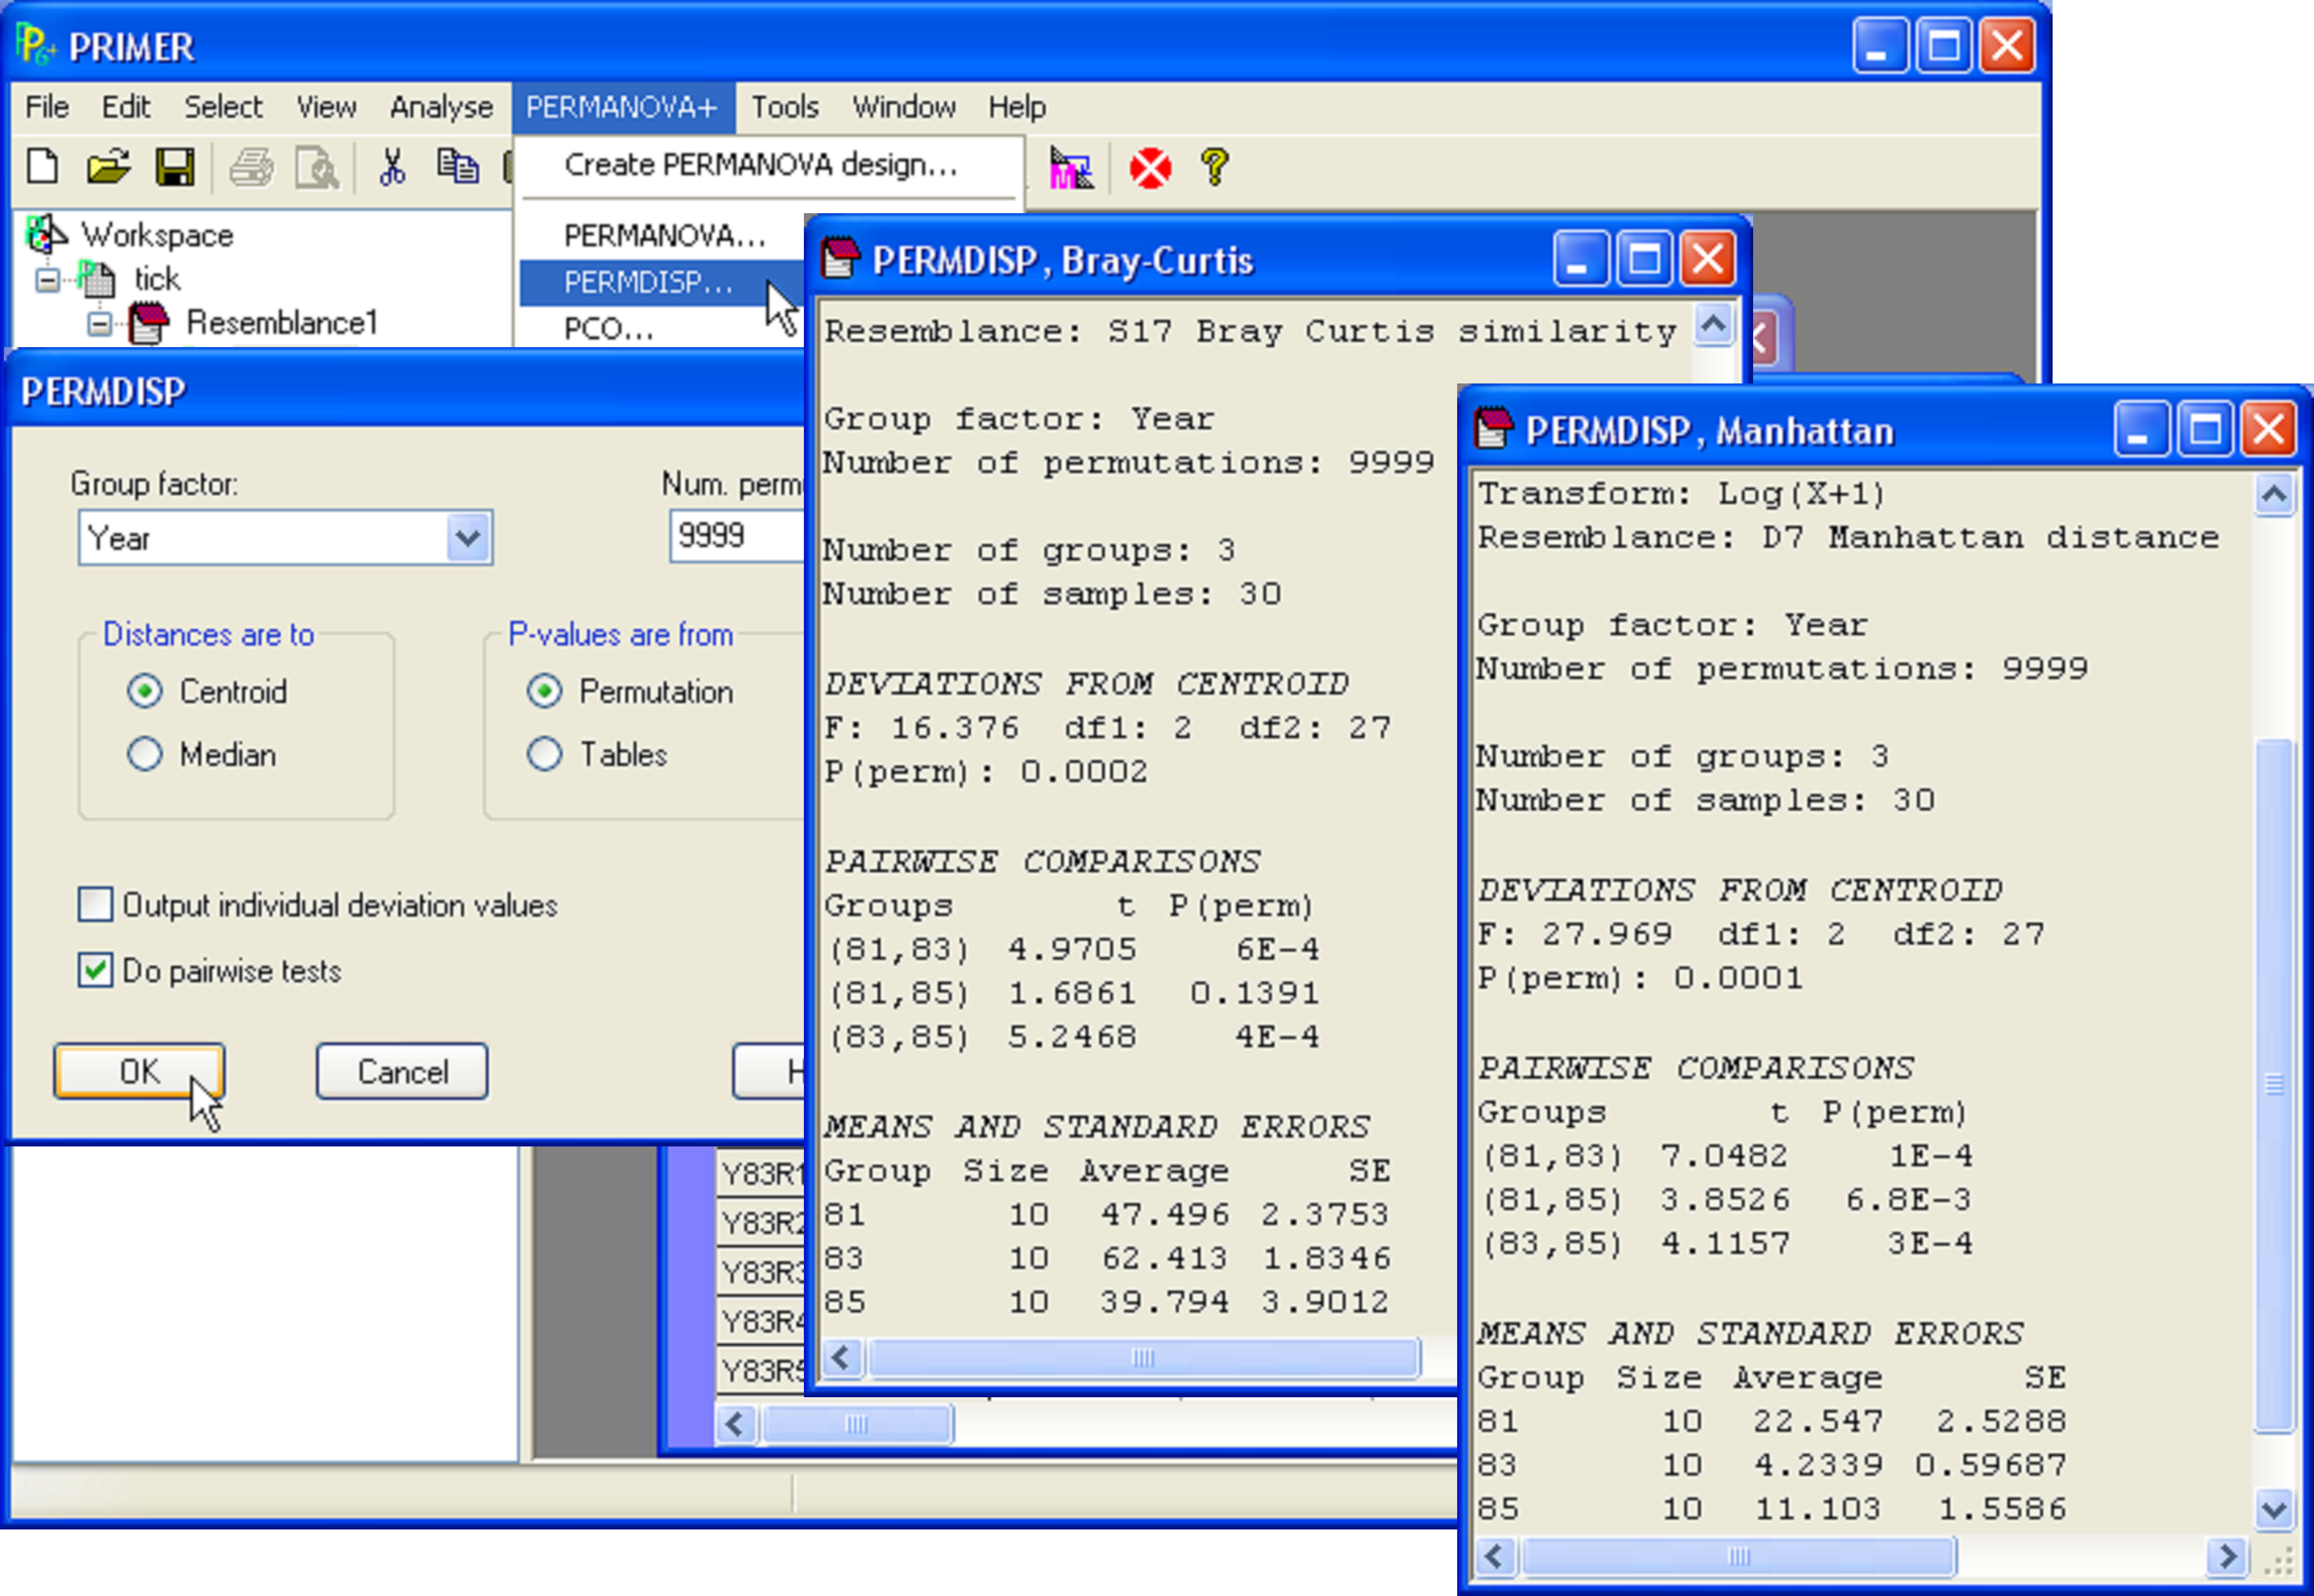
Fig. 2.6. PERMDISP for Tikus Island coral data using Bray-Curtis, and also using Manhattan distances on log(x+1)-transformed data.
One of the important reasons for the large dissimilarities among samples in 1983 was because the El Niño caused a massive coral bleaching event, and many of the corals died. Those that remained were very patchy, were generally not the same species in different transects and had small cover values. A quick scan of the data file reveals the large number of zeros recorded in 1983; none of the coral species achieved percentage cover values above 4%. The sparse data in 1983 therefore yielded many Bray-Curtis similarities of zero (dissimilarities of 100%) among samples55.
55 Clarke, Somerfield & Chapman (2006) have discussed the potentially erratic behaviour and lack of discrimination of the Bray-Curtis measure for sparse data such as these, proposing an adjustment which consists of adding a “dummy” species (present everywhere) into the dataset. They show that, for these coral data, the adjustment does have the effect of stabilising the dispersion across years and optimising the year-to-year separation.