4.12 Vector overlays in dbRDA
Something which certainly should come as no surprise is to see the X variables playing an important role in driving the variation along dbRDA axes. Of course, the X variables must feature strongly here, because it is from these that the fitted variation is derived! To characterise the dbRDA axes, it is useful to determine the strength and direction of the relationship between individual X variables and these axes. A common method for visualising these relationships is to examine vector overlays on the ordination diagram, with one vector for each predictor variable. The positions and directions of appropriate vectors can be obtained by calculating the multiple partial correlations between each of the X variables and the dbRDA axis scores. These vectors can be interpreted as the effect of a given predictor variable on the construction of the constrained ordination picture – the longer the vector, the bigger the effect that variable has had in the construction of the dbRDA axes being viewed. If the ordination being viewed explains a large proportion of the variation in the fitted model (and we would hope that this is indeed generally true), then these vectors are also representative of the strength and direction of influence of individual X variables in the model itself. Note that these vectors show the strength of the relationships between each predictor variable and the dbRDA axes, given that it is fitted simultaneously with the other X variables in the model. In other words, the calculation of the correlation between each X variable and each dbRDA axis is conditional upon (i.e. takes into account) all of the other X variables in the worksheet.
Although the above vector overlay is shown by default in the dbRDA ordination graphic, there are other kinds of potentially informative vector overlays. For example, one might choose to plot the simple Pearson (or Spearman) correlations of the X variables with the dbRDA axes, as was shown for PCO plots in the section Vector overlays in chapter 3. Note, however, that each of these vectors is drawn individually, ignoring the other variables in the worksheet89. In PRIMER, there are therefore three different kinds of vector overlays offered for dbRDA plots as part of the PERMANOVA+ add-on. These are obtained as follows from within the ‘Configuration Plot’ dialog90 (presuming for the moment that the predictor variables that gave rise to the model are located in a worksheet named X):
-
Default dbRDA vector overlay, corresponding to multiple partial correlations of the (centred) X variables with the dbRDA axes: choose (Vectors: •Base variables). These vectors are identical to those that are obtained using the choice (Vectors: •Worksheet variables: X > Correlation type: Multiple).
-
Pearson simple linear correlations of individual X variables with the dbRDA axes: choose (Vectors: •Worksheet variables: X > Correlation type: Pearson)
-
Spearman simple rank correlations of the X variables with the dbRDA axes: choose (Vectors: •Worksheet variables: X > Correlation type: Spearman)
Of course, some other variables (and not just the predictor variables that gave rise to the dbRDA axes) can also be superimposed on the dbRDA ordination diagram using this general vector overlay tool. Bubble plots (see p. 83 in chapter 7 of Clarke & Gorley (2006) ) can also be useful to visualise the relative values of an individual variable among sample points in a dbRDA ordination.
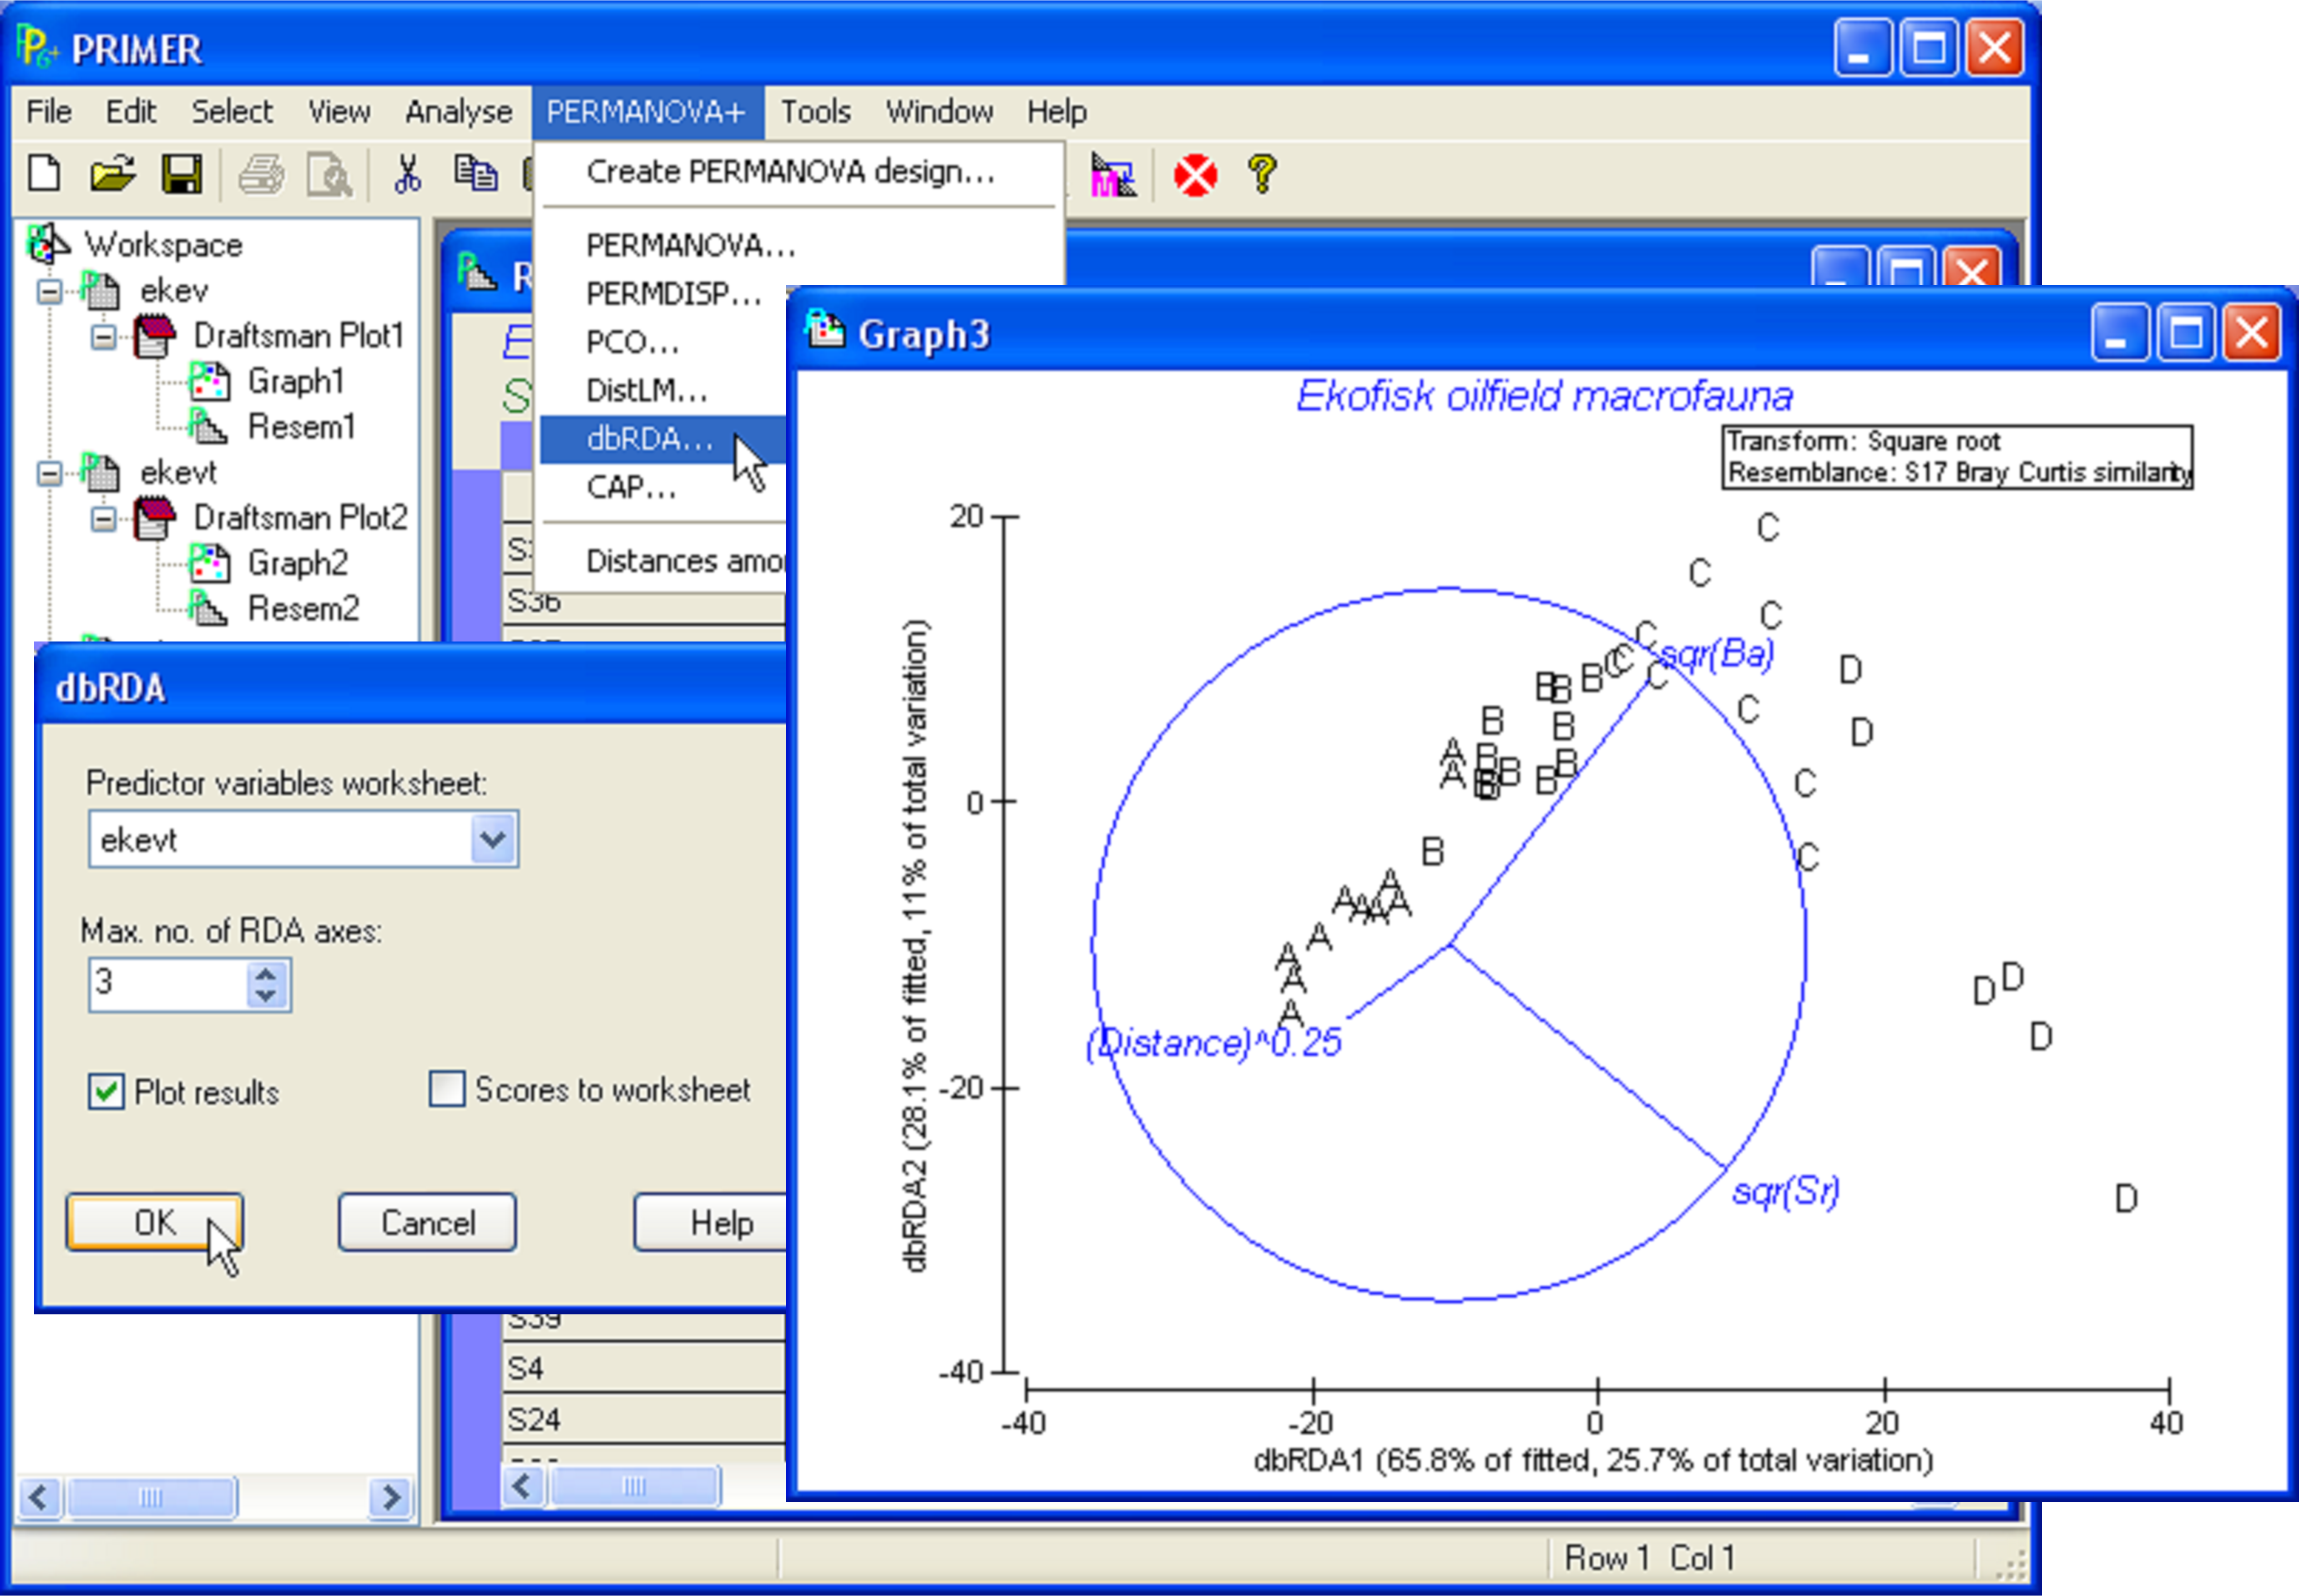
Fig. 4.16. dbRDA of the Ekofisk data from the parsimonious model with three environmental variables.
Clearly, the type of vectors to plot is up to the user and depends on the type of information being sought. When publishing a dbRDA plot as part of a study, it is important to give information about the variation explained by the axes (out of the fitted and out of the total variation) and also to indicate which type of vector overlays are being used, if any are displayed. Of course, all of the other graphical options and tools available from within PRIMER are also able to be used in dbRDA plots, including 3-dimensional representation, spin, options for symbols and labels, fonts, colours, and so on. See Clarke & Gorley (2006) for more details.
89 Although ter Braak (1990) suggested that individual Pearson correlations (ignoring other X variables) are most informative, Rencher ( Rencher (1988) , Rencher (1995) ) disagrees, stating that the multivariate nature of these inter-relationships is ignored by using raw correlations, which show only univariate relationships. Both types of vector overlay are available within the PERMANOVA+ add-on.
90 The ‘Configuration Plot’ dialog is obtained for any plot by choosing Graph > Special.