2.9 Dispersion as beta diversity (Norwegian macrofauna)
When used on species composition (presence/absence) data in conjunction with certain resemblance measures, the test for homogeneity of multivariate dispersions is directly interpretable as a test for similarity in beta diversity among groups ( Anderson, Ellingsen & McArdle (2006) ). Whittaker ( Whittaker (1960) , Whittaker (1972) ) defined beta diversity as the degree to which a set of observations in a given geographical area vary in the identities of species they contain. More specifically, he proposed a measure of beta diversity as the proportion by which a given area is richer than the average of the samples within it. Although there may be many ways to define beta diversity (e.g., Vellend (2001) , Magurran (2004) ), Anderson, Ellingsen & McArdle (2006) considered that beta diversity can be broadly defined as the variability in species composition among sampling units for a given area at a given spatial scale. Whittaker’s measure (as a proportion) only provides a single value per area (or group), so cannot be used to test for differences among groups in beta diversity57. However, PERMDISP on the basis of ecological measures of compositional dissimilarity (e.g., Jaccard or Sørensen, which is just Bray-Curtis on presence/absence data) can be used for such a test. Note that the definition of beta diversity is focused on variability in composition. Thus, multivariate dispersion on the basis of any resemblance measure that includes relative abundance information as well will not necessarily provide a measure of beta diversity, per se.58
Ellingsen & Gray (2002) studied beta diversity and its relationship with environmental heterogeneity in benthic marine systems over large spatial scales in the North Sea. Samples of soft-sediment macrobenthic organisms were obtained from N = 101 sites occurring in five large areas along a transect of 15 degrees of latitude (Fig. 2.8). A total of p = 809 taxa were recorded overall, and samples consisted of abundances pooled across five benthic grabs obtained at each site. The upper 5 cm of one additional grab was also sampled to measure environmental variables at each site. Of interest was to measure beta diversity (the degree of compositional heterogeneity) for each of these five areas and to compare this with variation in the environmental variables. The biological data are provided in the file norbio.pri in the ‘NorMac’ folder in the ‘Examples add-on’ directory.
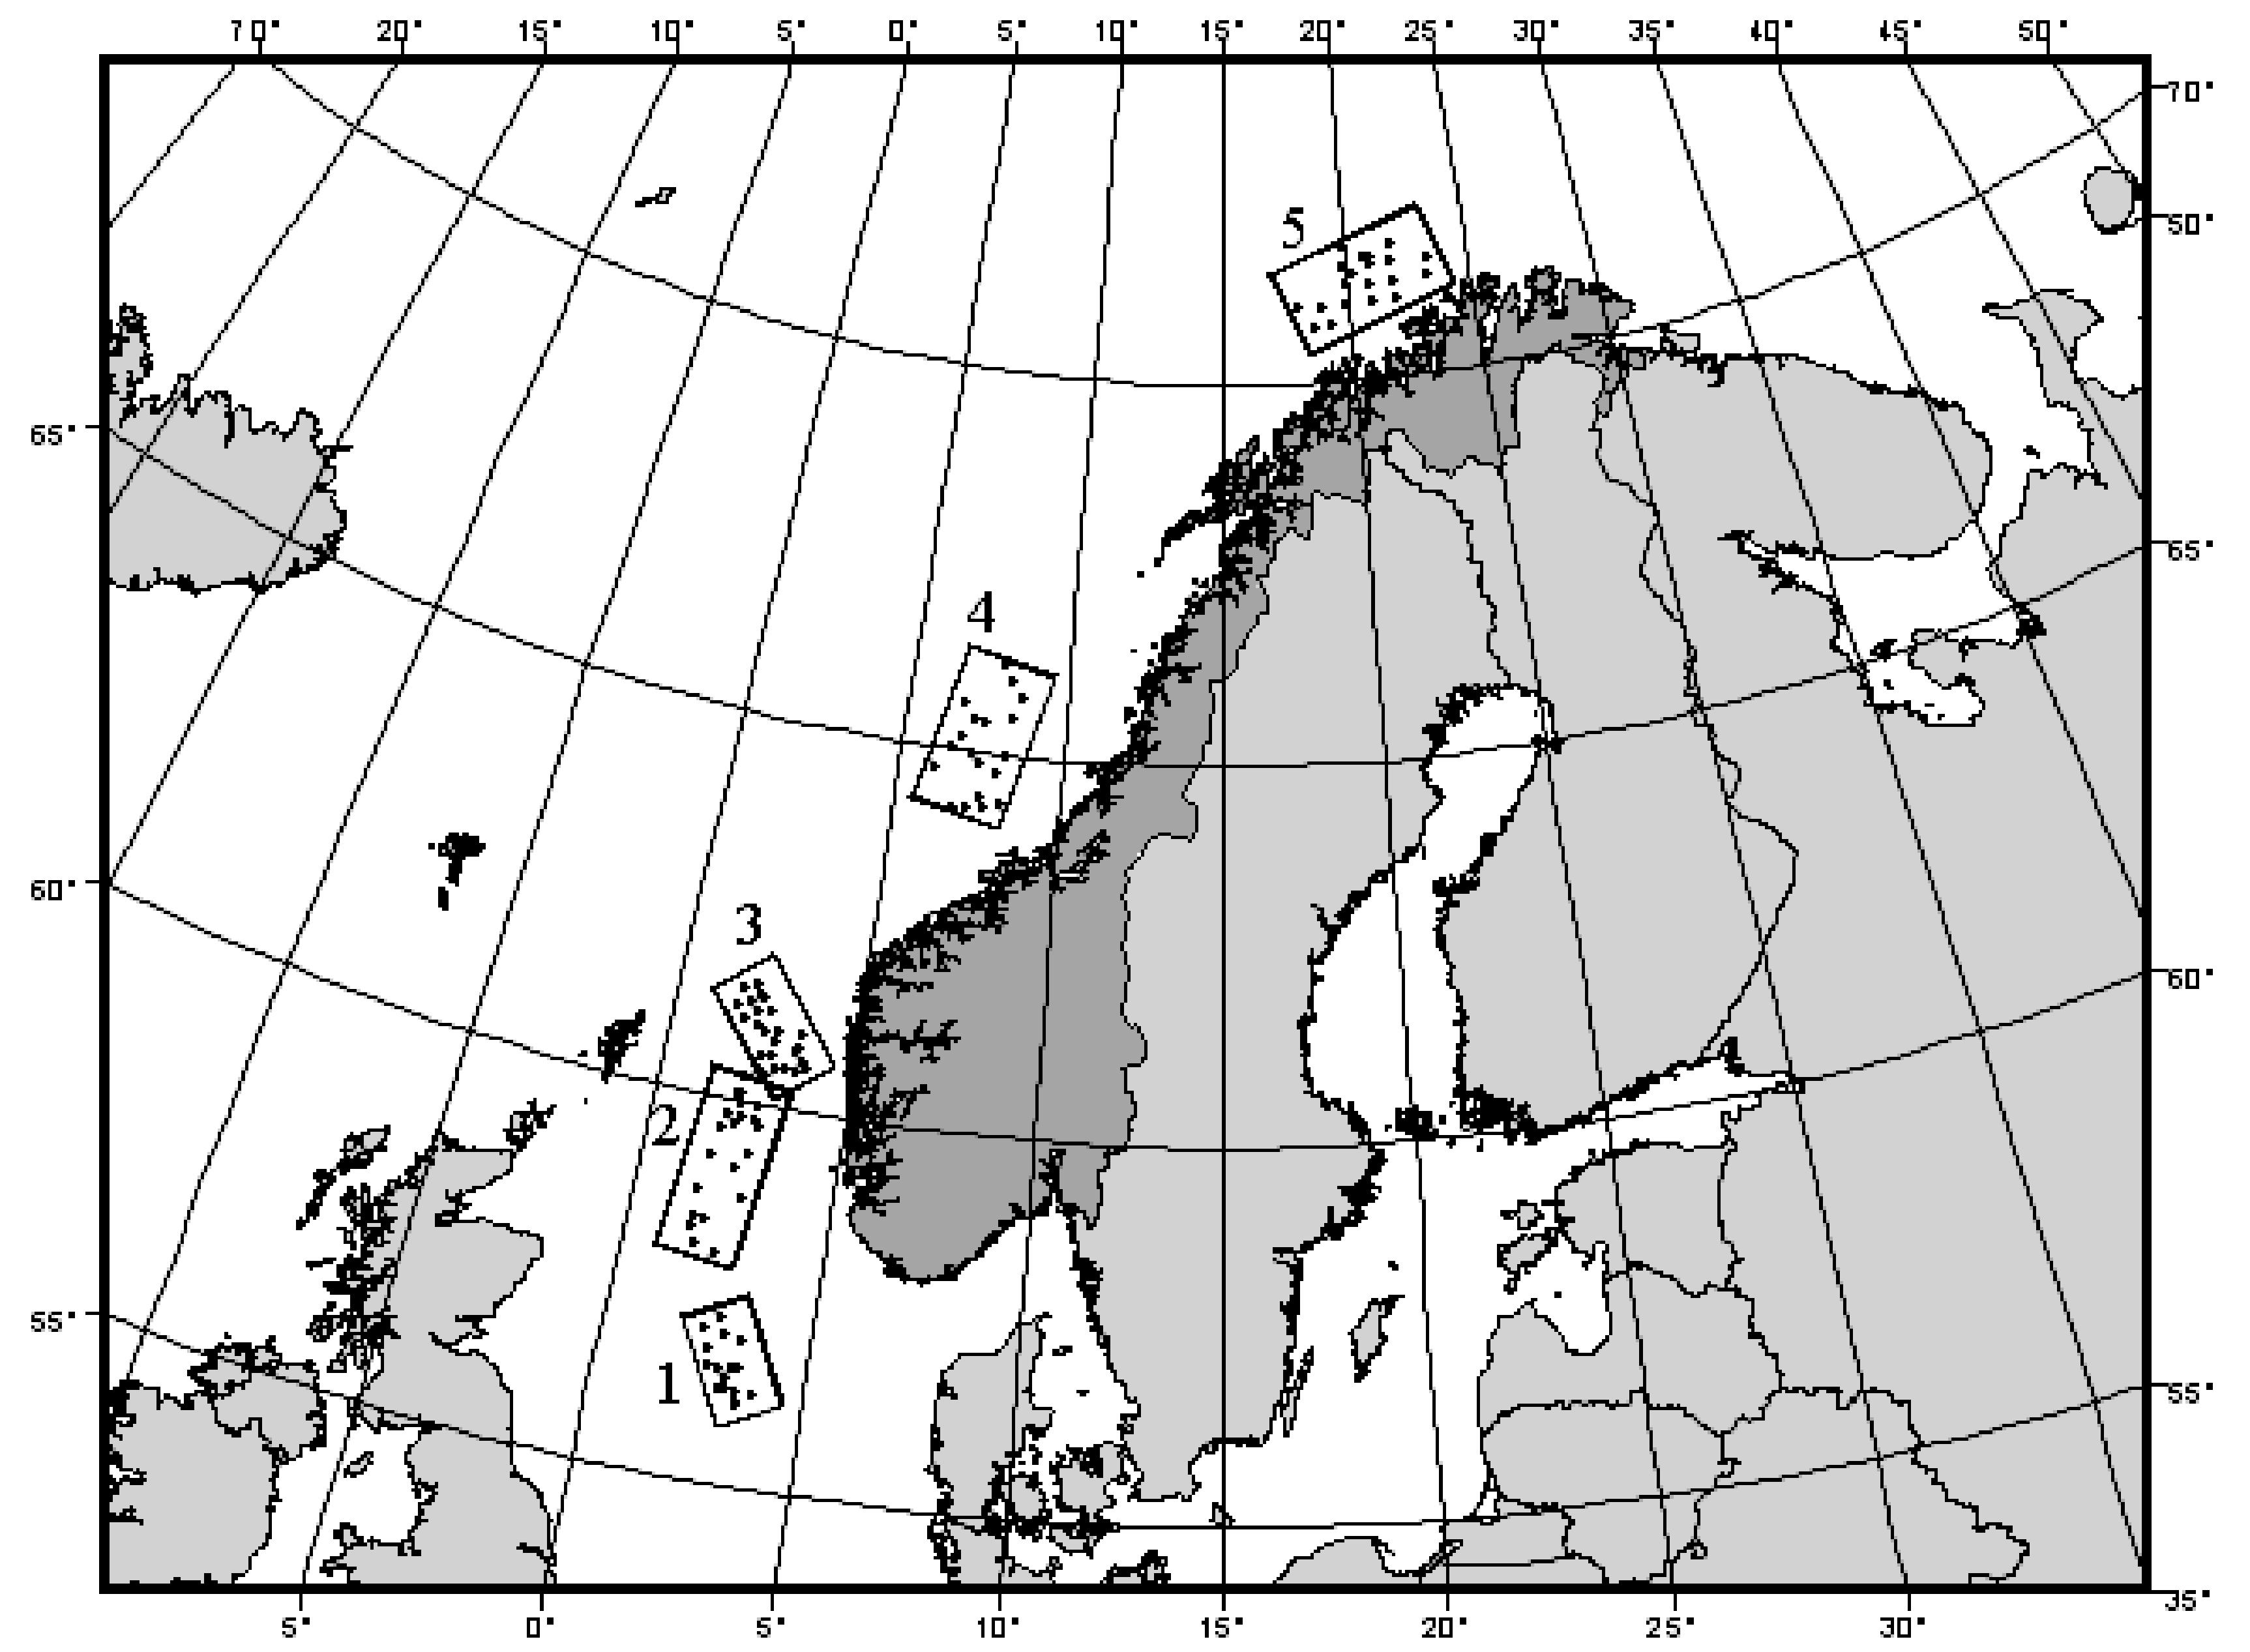
Fig. 2.8. Map showing locations of samples of macrobenthic fauna taken from each of 5 areas in the North Sea (after Ellingsen & Gray (2002) ).
An MDS plot on the basis of the Jaccard measure shows patterns of differences in assemblage composition among the five areas (Fig. 2.9). The Jaccard measure is directly interpretable as the percentage of unshared species. It uses only presence/absence information and measures of multivariate dispersion based on this measure are indeed interpretable as measures of beta diversity. Perhaps the most striking thing emerging from the plot is the quite large spread of sample points corresponding to area 3 and the quite tight cluster of points corresponding to area 1 compared to the other areas. The test for homogeneity reveals very strong differences among the five groups and, more particularly, identifies group 1 and group 3 as being significantly different from one another and from the other three groups (2, 4 and 5) in terms of their variability in species composition59 (Fig. 2.9). The average Jaccard distance-to-centroid is about 36% for group 1, but is much larger (more than 56%) for group 3. This pattern of heterogeneity was mirrored by similar patterns of variability in the environmental variables for the three areas (see Ellingsen & Gray (2002) and Anderson, Ellingsen & McArdle (2006) for more details). One possible explanation for the relatively large biological and environmental variation in area 3 is that this may be an area of rapid transition from the southern to the northern climes.
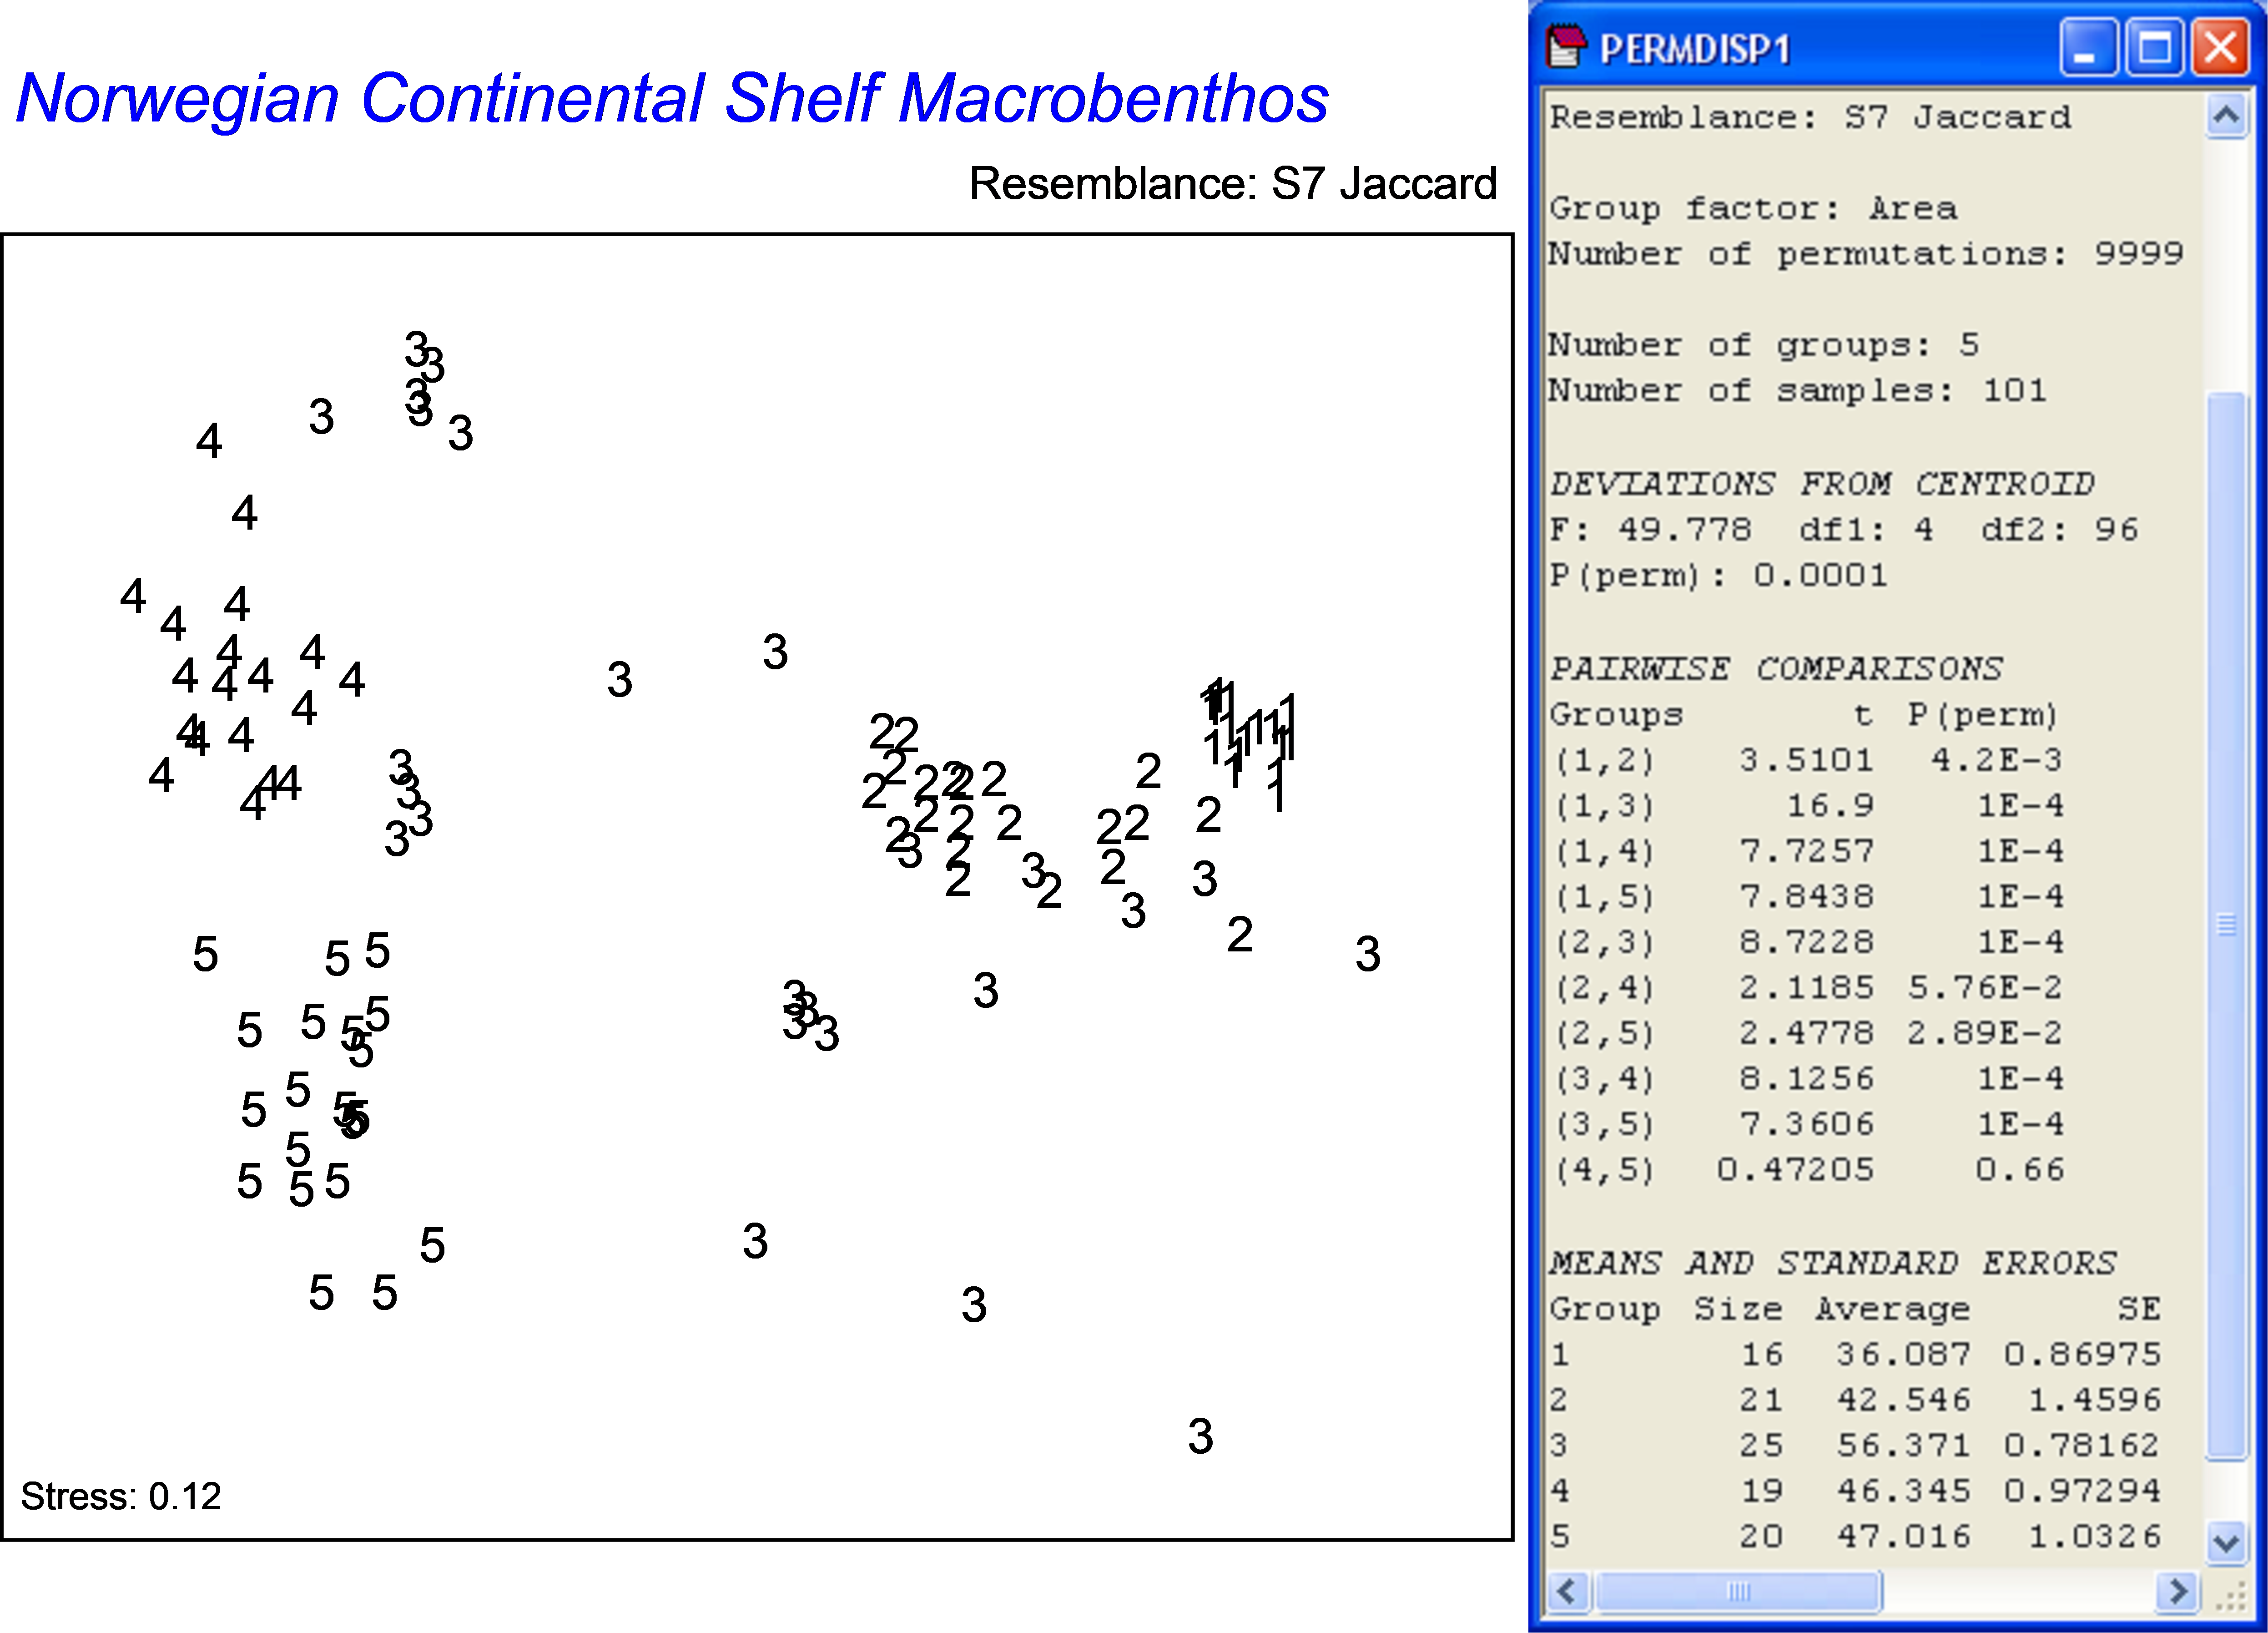
Fig. 2.9. MDS of Norwegian macrofauna from 5 areas (labelled 1-5 as on the map in Fig. 2.8) based on the Jaccard measure and the results of PERMDISP, alongside, comparing beta diversity among the 5 areas.
57 See Kiflawi & Spencer (2004) , however, who have shown how expressing beta diversities in terms of an odds ratio does allow confidence intervals to be constructed.
58 If we allow dispersion based on any resemblance measure to be considered “beta diversity”, then beta diversity simply becomes a non-concept (sensu Hurlbert (1971) ). For example, compare Figures 2.5 and 2.7; surely we cannot claim that both of these describe relative patterns in beta diversity for the same dataset!
59 Note that in PERMDISP, as in PERMANOVA, the pairwise tests are not corrected for multiple comparisons. See the section on Pairwise comparisons in chapter 1 on PERMANOVA for more details