1.10 Running PERMANOVA
To run PERMANOVA on the Ekofisk data, click on the resemblance matrix and select PERMANOVA+ > PERMANOVA. In the PERMANOVA dialog box (Fig. 1.9), leave the defaults for all options, except (Num. permutations: 9999) & (Permutation method: $\bullet$Unrestricted permutation of raw data). Although any of the available methods of permutation offered by PERMANOVA are sound (see the section Methods of permutation), permutation of raw data will provide an exact test for a simple one-way design. In addition, although the default for the number of permutations is 999, it is clearly desirable to perform as many permutations as reasonable time will allow. Power and precision increase with increases in the number of permutations ( Hope (1968) ). Manly (2006) , (pp. 94-98), suggested that, to draw inferences at a significance level of 0.05, P-values should be calculated using at least 999 permutations, whereas 4999 permutations should be done to draw inferences at a level of 0.01. The ever-increasing speed of personal computers generally allows a large number to be chosen here for most designs with moderate sample sizes. Recall also that PERMANOVA obtains a random subset of all possible permutations, so will not necessarily reproduce exactly the same P-value for a given test if the analysis is run again. However, any such difference from one run to the next will be small (in the 3rd decimal place for 9999 permutations).
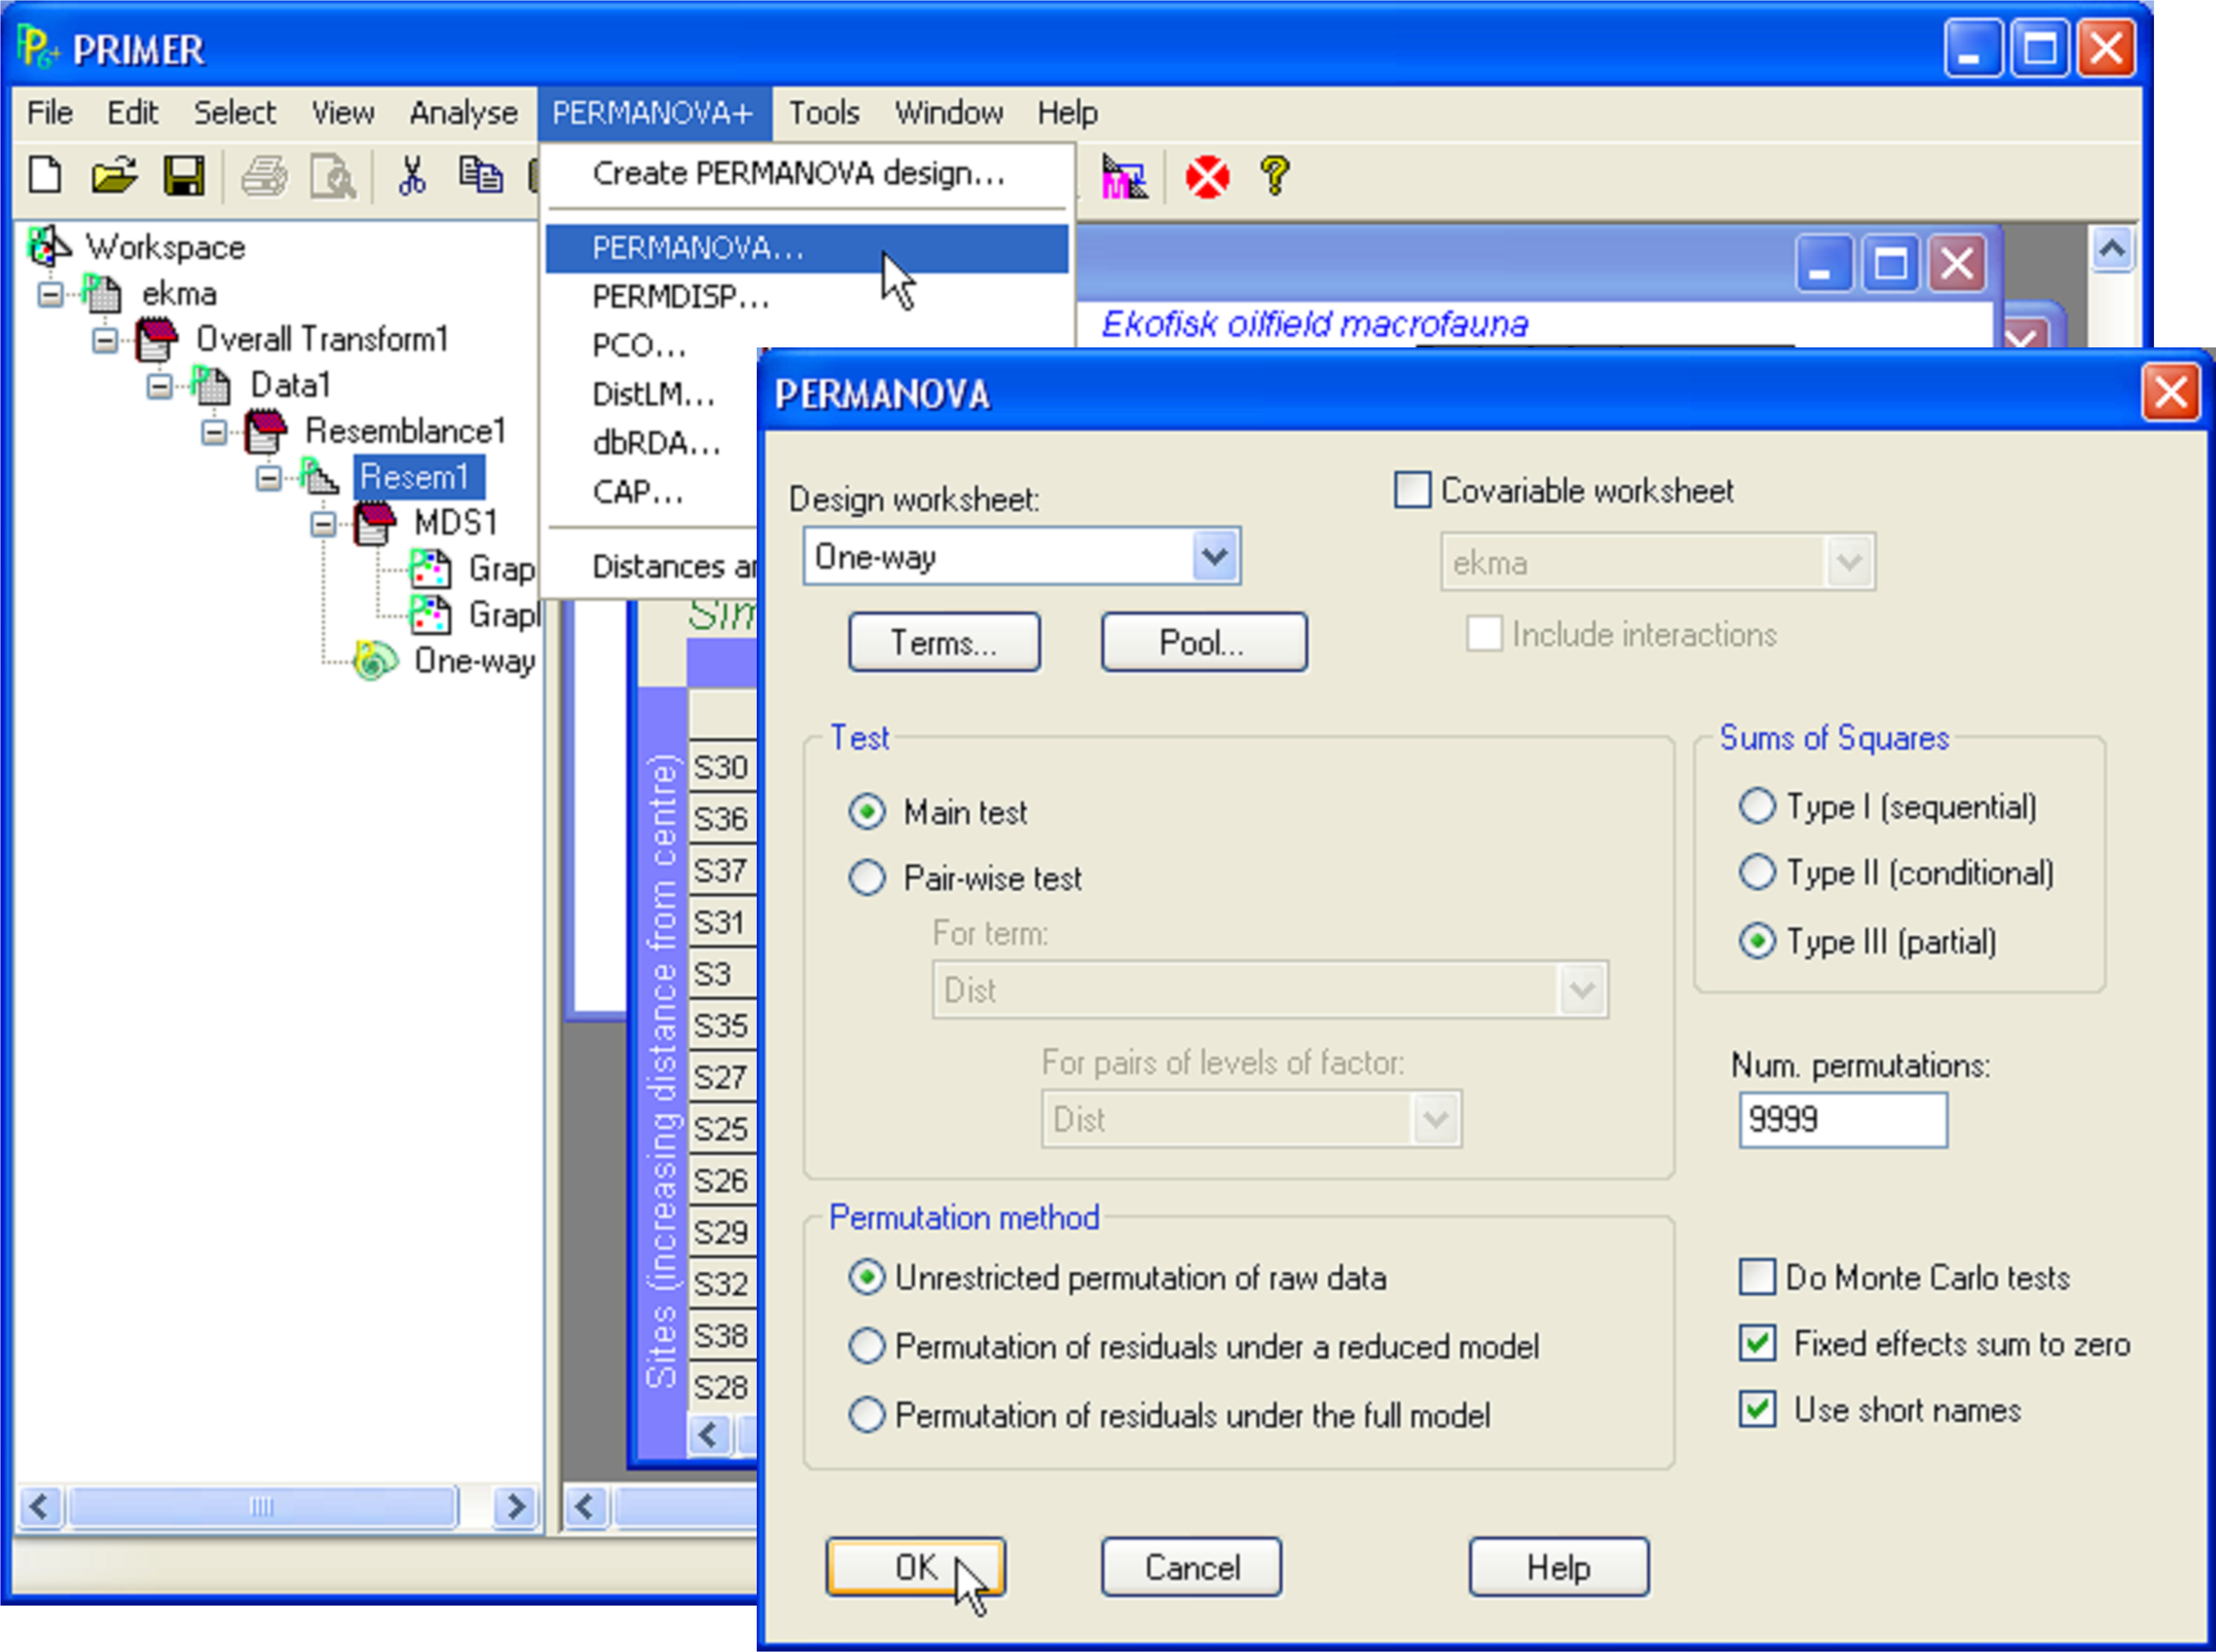 Fig. 1.9. The dialog box for running PERMANOVA.
The results of PERMANOVA are shown in a new separate window with text-form information for this analysis (Fig. 1.10). The first part of the file provides information regarding the choices made, such as transformations, the resemblance measure and the method and number of permutations. There is also information regarding the experimental design and whether any terms were excluded (see the section Pooling or excluding terms). The default ‘Type’ of sums of squares is Type III, which will be discussed in detail in the section Unbalanced designs. These three types of sums of squares are equivalent for one-way models or any balanced (equal replication) ANOVA designs, so need not concern us here.
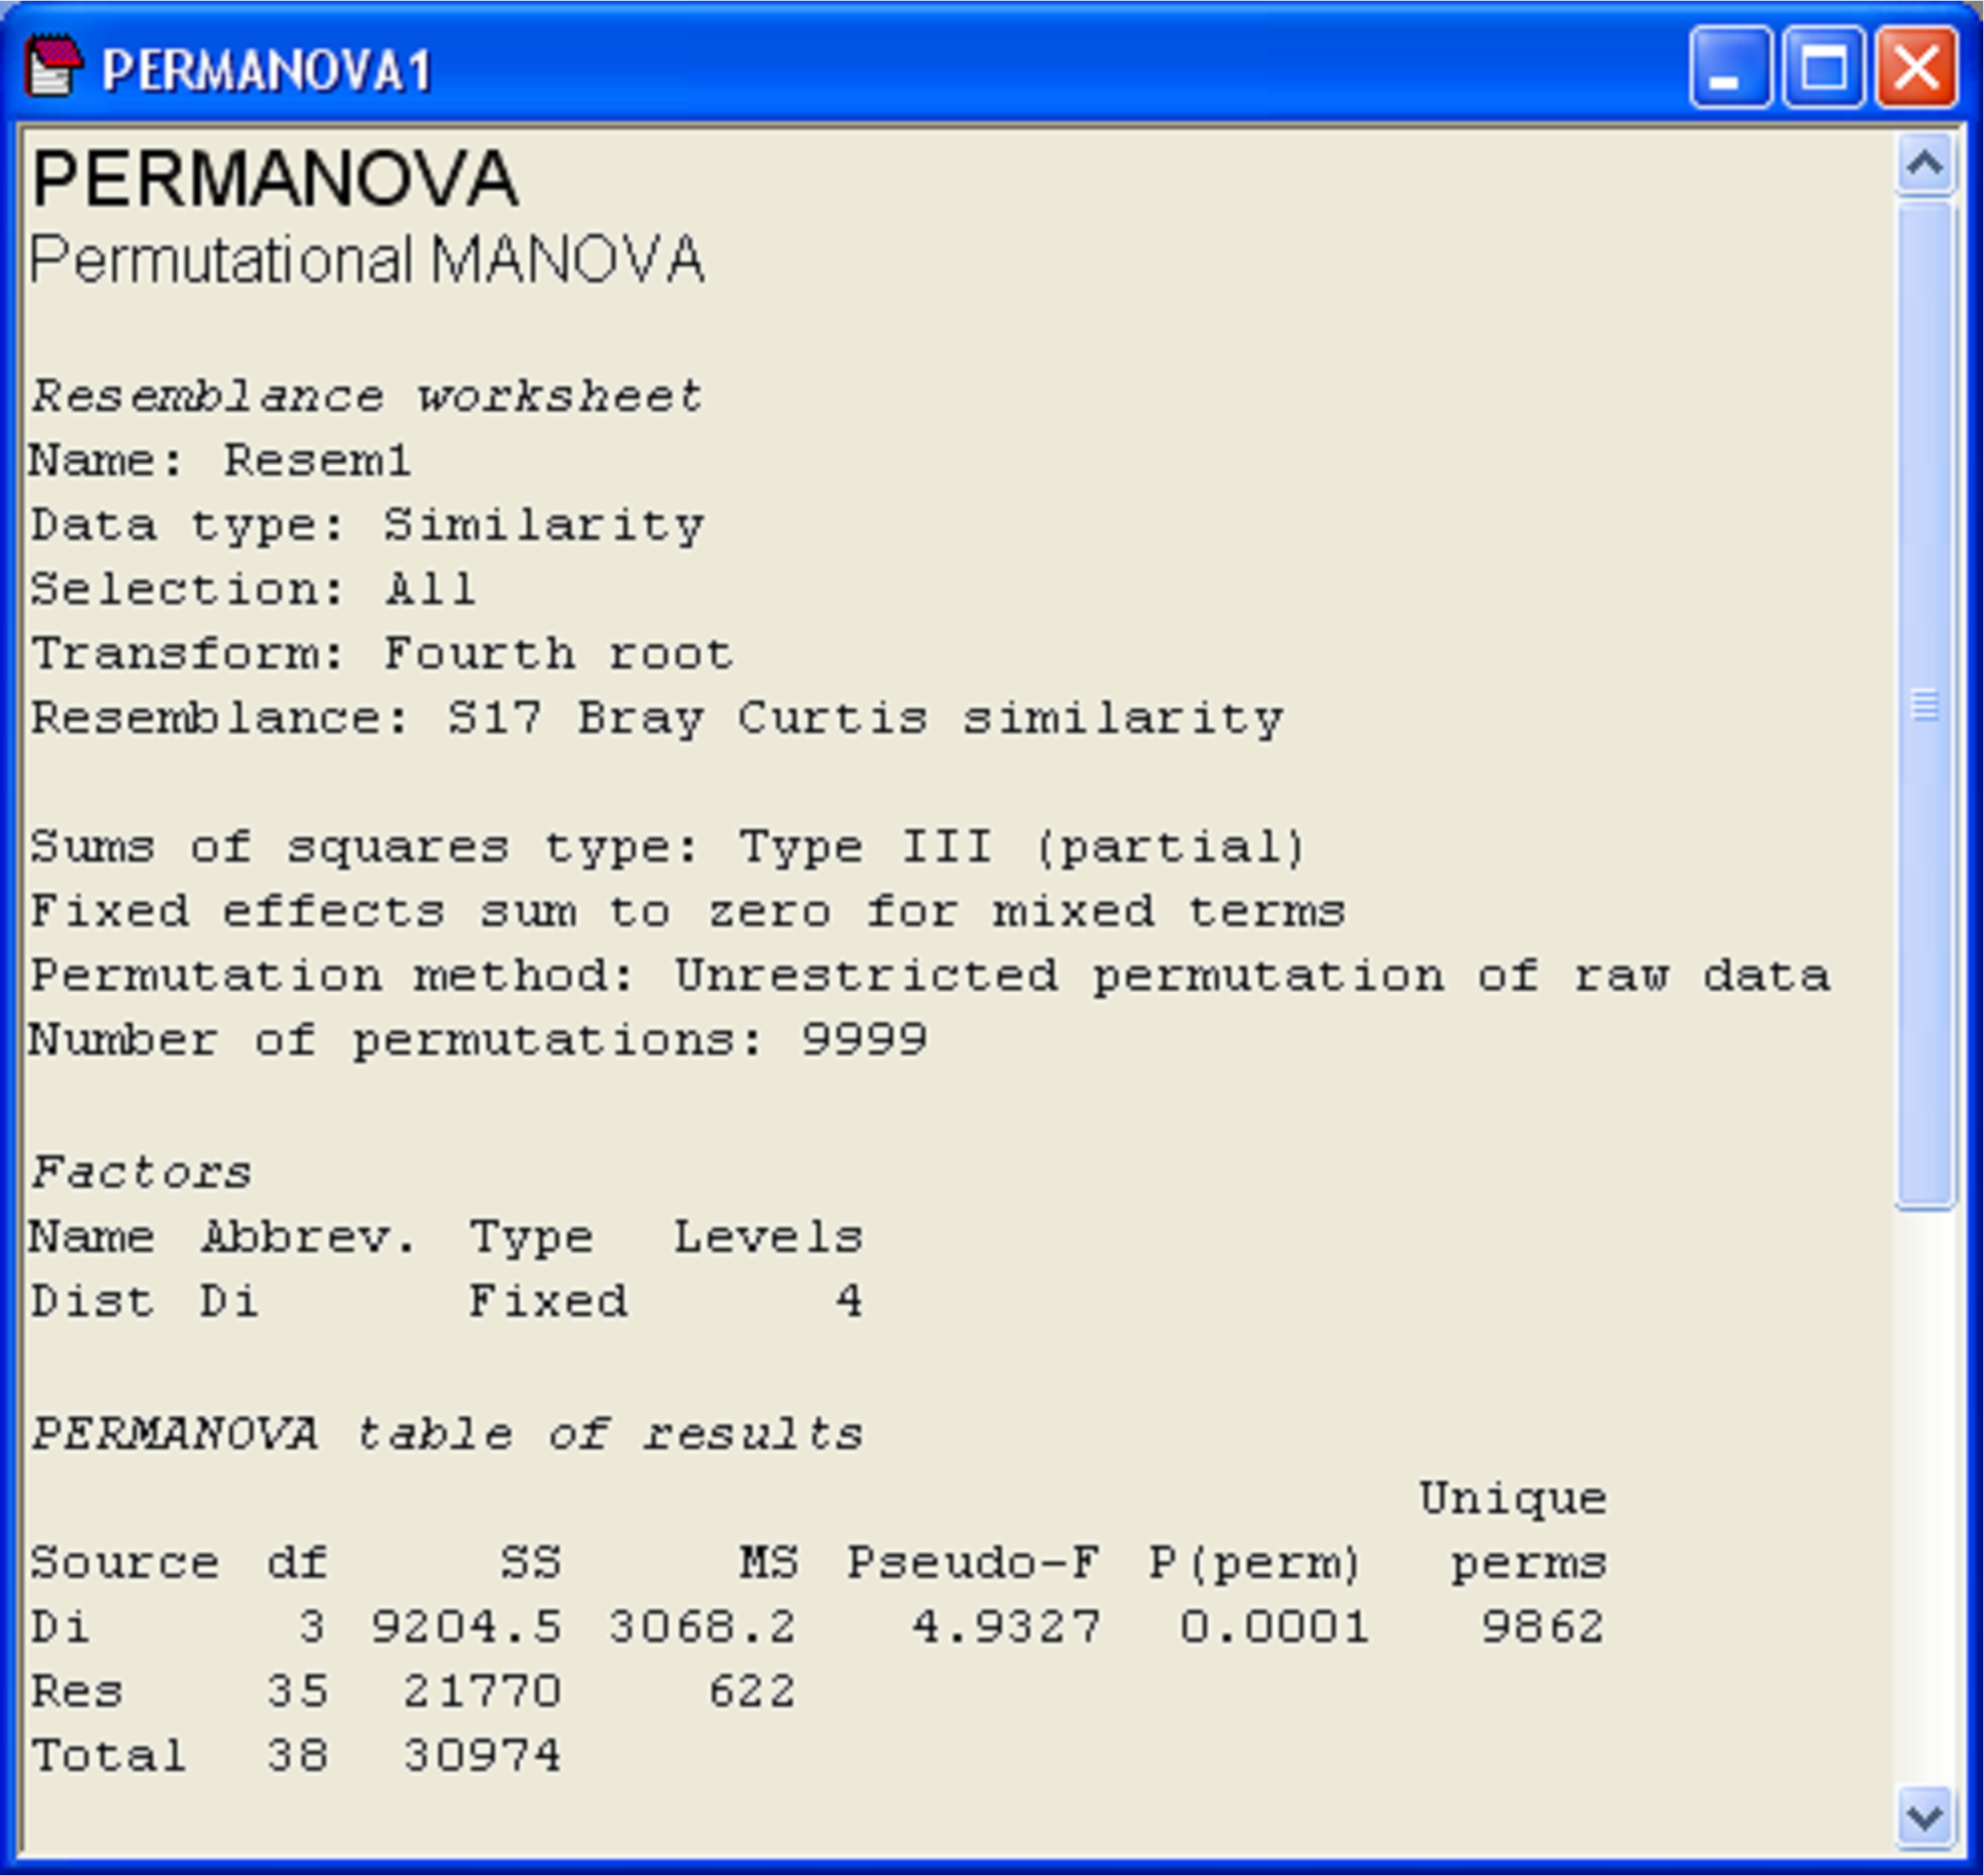 Fig. 1.10. Window of results from PERMANOVA on the Ekofisk macrofauna.
The essential information of interest is provided in the ‘PERMANOVA table of results’, which contains the sources of variation in the model (‘Source’), the degrees of freedom (‘df’), sums of squares (‘SS’), mean squares (‘MS’), pseudo-F ratio (‘Pseudo-F’) and permutation P-value (‘P(perm)’). This table can be read and interpreted in a way that is directly analogous to a traditional ANOVA, but bear in mind that what is being partitioned here is multivariate variability based on the chosen resemblance measure, with P-values obtained using permutations15.
The last column of the PERMANOVA table (‘Unique perms’) indicates how many unique values of the test statistic were obtained under permutation. Recall that PERMANOVA does not systematically do all permutations, but rather draws a random subset of them. In the example (Fig. 1.10), this value is very large (9862) and close to the number of random permutations that were chosen to be done by the user (9999). This means that only a few repeated values of pseudo-F$\pi$ were encountered under permutation, and the number of unique values is plenty enough to make reasonable inferences using the resulting permutation P-value, as shown. This information is important because, in some cases, the number of possible permutations is not large, and very few unique values of the test statistic are obtained. In such cases, a more meaningful (but approximate) P-value can be obtained by random sampling from the asymptotic permutation distribution instead (see the section Monte Carlo P-values).
Underneath the PERMANOVA table of results are given further details regarding the analysis, including the expected mean squares (EMS) for each term in the model, the construction of the F ratio and the estimated sizes of components of variation (see the sections Components of variation, Expected mean squares, Constructing F from EMS and Estimating components of variation).
For the Ekofisk example, there is indeed a significant effect of the distance groupings (Fig. 1.10, pseudo-F = 4.93, P = 0.0001). A natural next question to ask is: wherein do these significant differences lie? That is, which groups differ significantly from which other groups?
15 For the one-way case, such as this, the PERMANOVA permutation P-values are exact; however, for multi-factor models, especially mixed models, analyses with covariates or unbalanced designs, the P-values provided are, necessarily, approximate, and rely on the exchangeability of residuals from the linear ANOVA model being fitted.