3.9 PCO versus MDS
We recommend that, for routine ordination to visualise multivariate data on the basis of a chosen resemblance measure, non-metric MDS is the method of choice ( Kruskal (1964) ; Minchin (1987) ). MDS is robust to outliers, and it explicitly uses a criterion of preserving rank orders of dissimilarities in a reduced number of dimensions, so has excellent distance-preserving properties.
In practice, PCO and MDS will tend to give similar results for a given resemblance matrix. Generally, far more important to the resulting patterns seen in the ordination will be the decisions made regarding the choice of transformation, standardisation and resemblance measure. Trials with a few examples will demonstrate this and are left to the reader to explore. There are, however, a few notable exceptions. Differences between MDS and PCO will be sharpest when there is a large split between groups of one or more samples in the multivariate space. In such cases, MDS can yield what is called a “degenerate” solution (see chapter 5 in Clarke & Warwick (2001) ), where all of the points within a group are tightly clustered or collapsed onto a single point in the MDS configuration. This occurs when all of the “within-group” dissimilarities are smaller than all of the “between-group” dissimilarities. As pointed out by Clarke & Warwick (2001) , in such cases “there is clearly no yardstick within our non-parametric approach for determining how far apart the groups should be placed in the MDS plot”. However, by choosing to use PCO in such cases, we are provided with just such a yardstick.
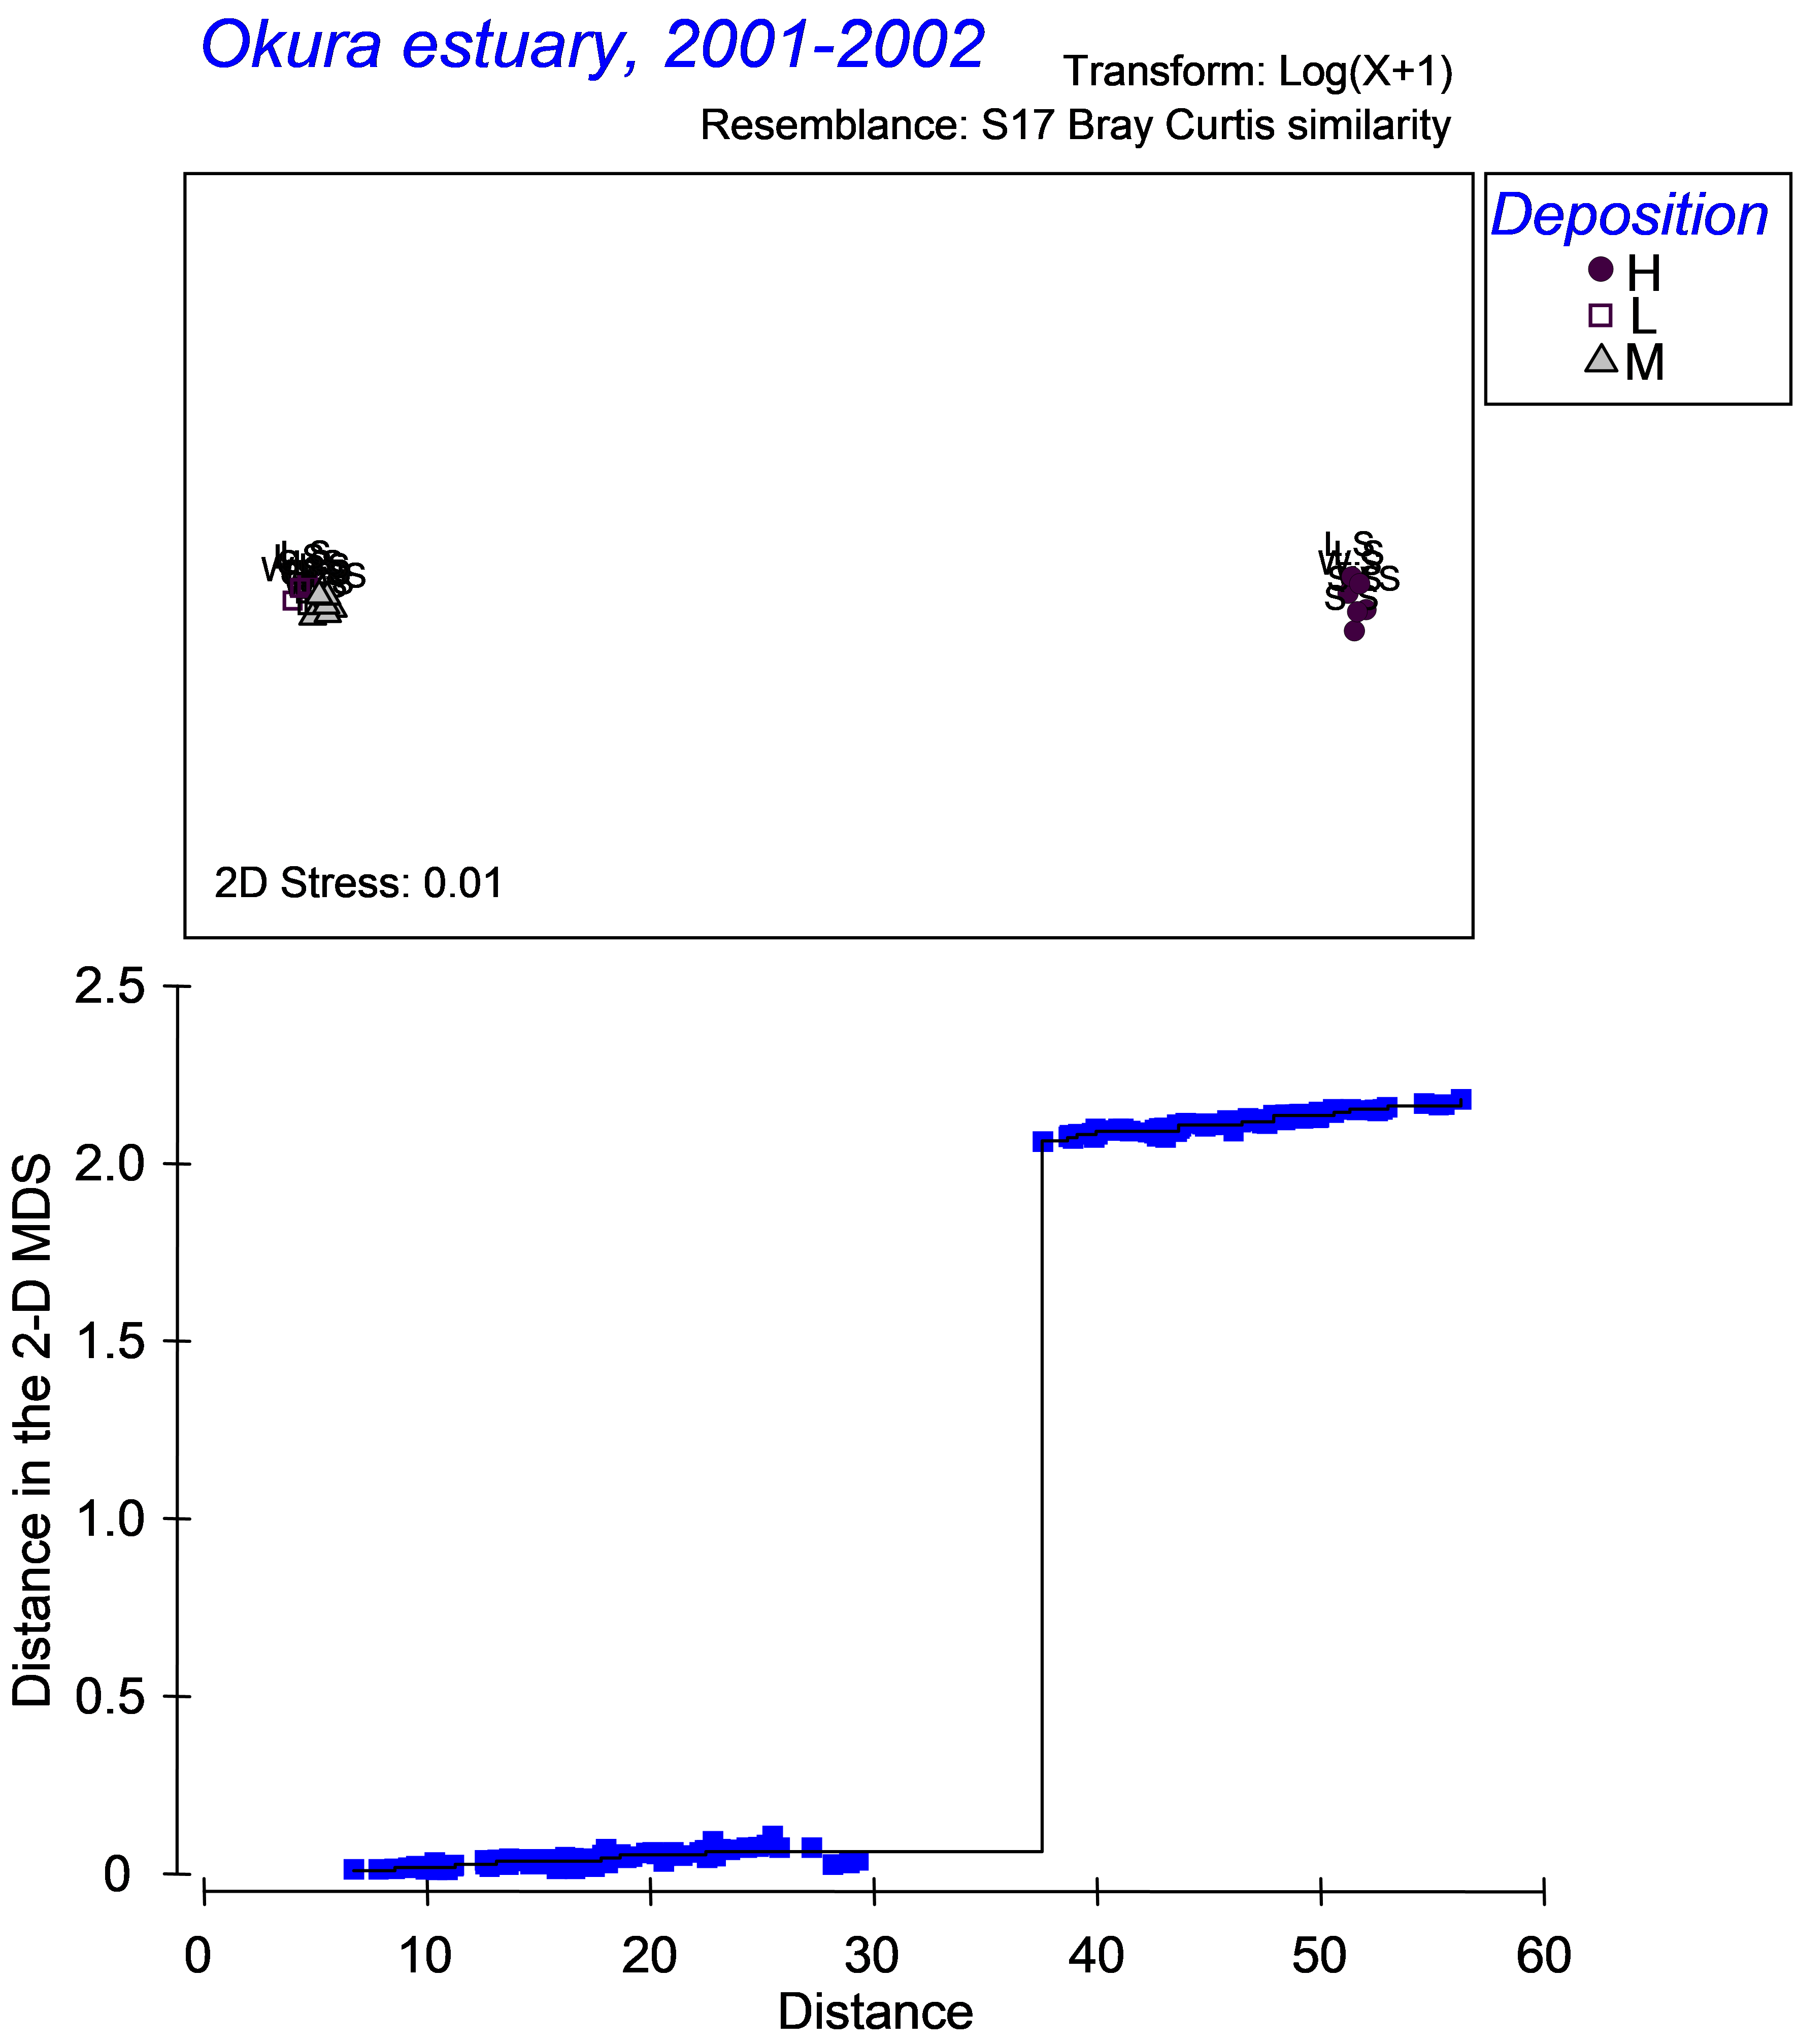 Fig. 3.14. MDS of distances among centroids on the basis of the Bray-Curtis measure of log(X+1)-transformed abundances for Okura macrofauna (top panel) and associated Shepard diagram (bottom panel).
A case in point is the resemblance matrix among centroids analysed using PCO in Fig. 3.13 for the macrofauna from Okura estuary. An MDS plot of this resemblance matrix, and the associated Shepard plot, highlighting the two disjunctive sets of “within-group” and “between-group” dissimilarities, is shown in Fig. 3.14. Clearly, little or no information about the actual relative positions of these centroids can be gained from the MDS plot. The usual solution suggested for dealing with such cases is to carry out separate ordinations on each of the two groups. However, if our interest lies in visualising (as well as we can in a reduced number of dimensions, that is) the relative positions of the full set of centroids in the higher-dimensional space, especially to help us understand the relative quantitative differences among levels and associated effect sizes for factors, the MDS approach may let us down. In this case, it is not possible to relate the information or patterns in the MDS plot to the PERMANOVA output for this experimental design, and splitting the data into pieces will not particularly help here. The PCO routine does a much better job (Fig. 3.13).
As an aside, PCO is not only different from non-metric MDS, it also differs from what might generally be referred to as metric MDS. Both metric and nonmetric MDS encompass many methods (see Gower & Hand (1996) ), but their main focus is to minimise the criterion known as stress, a measure of how well the distances in the Euclidean configuration represent the original dissimilarities. Whereas the non-metric algorithms minimise stress as a monotonic function of the dissimilarities, their metric counterparts minimise stress using a linear or least-squares type of approach. Metric methods are also sometimes called least-squares scaling. Minimising a nonmetric stress criterion with a linear constraint is the same as minimising metric stress, though neither is equivalent to PCO. The point here is that MDS (metric or non-metric) is focused purely on preserving dissimilarities or distances in the configuration for a given number of dimensions, whereas PCO is a projection from the space of the resemblance measure onto Euclidean axes. The success of that projection, with respect to preserving dissimilarities, will therefore depend somewhat on just how high-dimensional the underlying data are and how ‘non-Euclidean’ the original resemblance measure is.
The strength of non-metric MDS lies in its flexible ‘stretching and squeezing’ of the resemblance scale, for example as dissimilarities push up against their upper limit of 100% (communities with no species in common). This focus on preserving rank-order relationships will generally give more sensible descriptions, e.g. of long-baseline gradients, in low dimensions than can be obtained by PCO. (The reader is encouraged to try out the comparison for some of the well-known data sets in the PRIMER ‘Examples v6’ directory, such as the macrofauna data in the Clydemac directory, the study met in Fig. 3.9). Paradoxically, however, the strength of PCO in the PERMANOVA context is precisely that it does not ‘stretch and squeeze’ the dissimilarity scale, so that where a low-dimensional PCO plot is able to capture the high-dimensional structure adequately (as reflected in the % variation explained), it is likely to give a closer reflection of the resemblance values actually used in the partitioning methods such as PERMANOVA and PERMDISP.