2.3 Multivariate Levene’s test (Bumpus’ sparrows)
Levene (1960) proposed doing an analysis of variance (ANOVA) on the absolute values of deviations of observations from their group mean. A multivariate analogue was described by van Valen (1978) and given in Manly (1994) , based on distances. Let $y _{ij}$ be a vector of p response variables for the jth observation in the ith group and let $\bar{y} _i$ be the centroid vector for group i, then the distance between each observation and its group centroid is a single value that can be denoted by $z _{ij}$. This is visualised easily in the case of two variables (two dimensions), as shown in Fig. 2.2 for the case of 2 groups. Once a value of z is calculated for each observation, this is treated as a univariate variable and the test consists of doing a traditional ANOVA comparing the values of z among the groups. The central idea here is that if the groups differ in their within-group dispersions, then the values of z (on average) will differ among the groups. Note that if Euclidean distance is used and there is only one variable, then the PERMDISP test is equivalent to the traditional univariate Levene’s test.
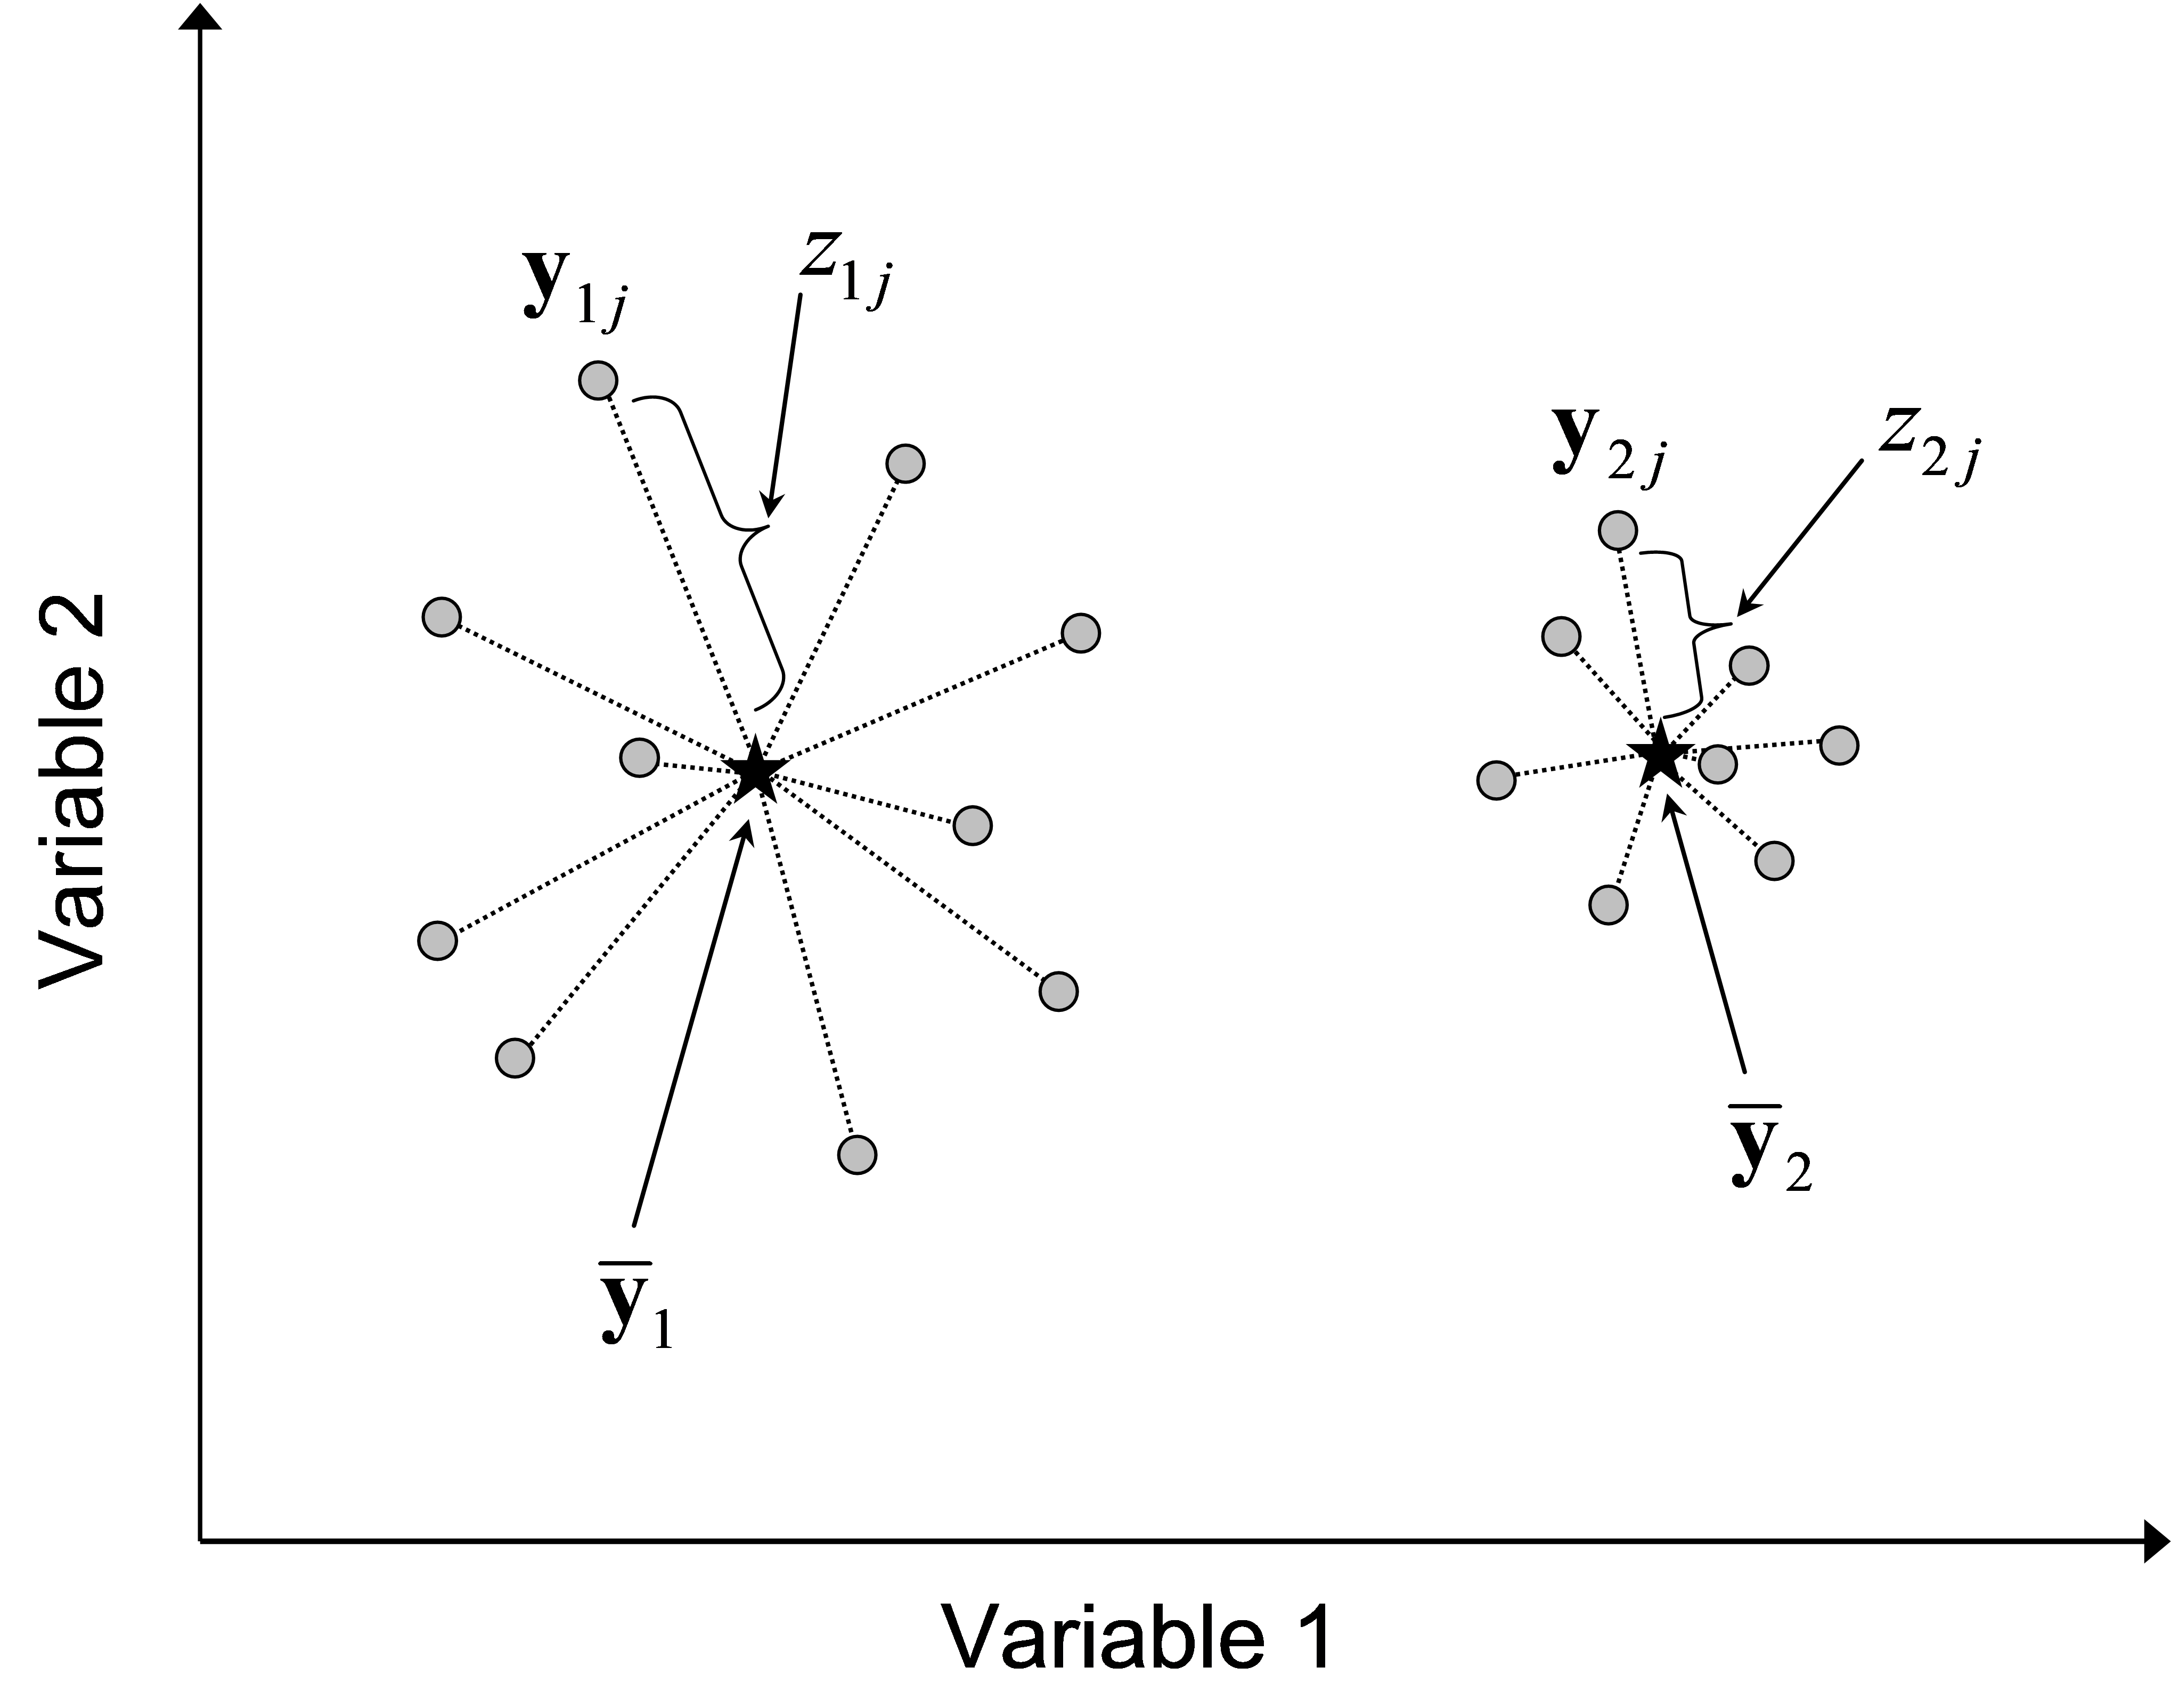
Fig. 2.2. Schematic diagram in a bivariate (two-variable) system showing the distances to centroids (z’s) for each of two groups, as used in a multivariate analogue to Levene’s test.
An example is provided by Manly (1994) who analysed the morphometric characteristics of sparrows from data due to Bumpus (1898) . It was hypothesised that stabilising selection acting on organisms should reduce the multivariate heterogeneity of their morphometric characteristics. The data consist of p = 5 morphometric variables (total length, alar extent, length of beak/head, length of humerus and length of keel of sternum, all in mm) from each of N = 49 female sparrows. Twenty-one of the sparrows died in a storm and twenty-eight survived. Of central interest is the question: are the morphologies of the sparrows that died more variable than for those that survived? That is, are sparrows with morphologies distant from the “norm” or “average” sparrow more likely to have died?
The data are located in the file spar.pri in the ‘BumpSpar’ folder of the ‘Examples add-on’ directory. Observations on the raw data (e.g., using a draftsman plot) reveal that the variables are quite well-behaved (approximately normal), as is usual with morphometric data, and that they are correlated with one another. A PCA (principal components analysis) would be a good idea for ordination (see chapter 4 of Clarke & Warwick (2001) for details). These variables are, however, on quite different measurement scales and so should be normalised before further analysis. Choose Analyse > Pre-treatment > Normalise variables. Next, for the normalised data, choose Analyse > PCA. The first two principal components account for about 83% of the total variation across the 5 variables and are shown in Fig. 2.3. There appears to be slightly greater variation in morphological characteristics (i.e. a slightly greater spread of points) for the sparrows that died compared to the ones that survived, but the extent of such differences, if any, can be difficult to discern in a reduced-space ordination plot.

Fig. 2.3. PCA ordination of Bumpus’ sparrows on the basis of 5 normalised morphometric variables.
To test the null hypothesis of no difference in dispersion between the two groups (Fig. 2.4), begin by selecting the normalised data and then choose Analyse > Resemblance > (Analyse between •Samples) & (Measure •Euclidean distance). From the resemblance matrix, choose PERMANOVA+ > PERMDISP > (Group factor: Group) & (Distances are to •Centroids) & (P-values are from •Tables). There is some evidence to suggest a difference in dispersion between the two groups, although the P-value obtained is borderline (F = 3.87, P = 0.055, Fig. 2.4).
 Fig. 2.4. Test of homogeneity of dispersions for Bumpus’ sparrow data on the basis of Euclidean distances of normalised variables using PERMDISP.
The output provides not only the value of the F ratio and its associated P-value, but also gives the mean and standard error for the z values in each group. These values are interpretable on the scale of the original resemblance measure chosen. Thus, in the present case, the average distance-to-centroid in the Euclidean space of the normalised morphometric variables is 1.73 for the sparrows that survived and 2.23 for the sparrows that died. The mean distance-to-centroid (± 1 standard error) might be usefully plotted in the case of there being many groups to compare (e.g., Anderson (2006) ). The individual z values obtained for each observation (from which the mean and standard errors are calculated) will also be provided in the results file if one chooses ($\checkmark$Output individual deviation values) in the PERMDISP dialog box (Fig. 2.4).