1.11 Pair-wise comparisons
Pair-wise comparisons among all pairs of levels of a given factor of interest are obtained by doing an additional separate run of the PERMANOVA routine. This is appropriate because which particular comparisons should be done, in most cases, is not known a priori, but instead will follow logically from the specific terms in the model found to be statistically significant in the main PERMANOVA analysis.
We could use the F ratio for the pair-wise tests as well, but a more natural statistic to use here is a direct multivariate analogue to the univariate t statistic. In traditional univariate analysis, an F test to examine the effects of a factor having only two groups is equivalent to performing a two-sample (two-tailed) t test. In fact, in this case the t statistic for comparing two groups is simply equal to the square root of the F ratio. Similarly, when PERMANOVA performs pair-wise tests, it takes each pair of levels to be compared, in turn and, treating it like a specific contrast, calculates pseudo-t as the square root of pseudo-F. If a single response variable is being analysed and the resemblance measure chosen is Euclidean distance, then the t statistics calculated by PERMANOVA for the pair-wise tests correspond exactly to Gosset’s original t statistic ( Student (1908) ). However, unlike traditional statistics packages, P-values for all pair-wise tests in PERMANOVA are obtained using permutations, not tables. This is necessary because, if the data are not normal, if more than one variable is being analysed and/or if the distance measure used is not Euclidean distance, then the distribution of this pseudo-t statistic under a true null hypothesis is unknown, so (as with pseudo-F), we generate it using permutations.
To run pair-wise comparisons for the Ekofisk example, click on the window containing the resemblance matrix once again and select PERMANOVA+ > PERMANOVA. All of the choices in the dialog box that were made for the main test should still be there. (PRIMER v6 has a good memory!) Most of these will remain as before. The same design file is needed (One-way), but this time choose (Test > $\bullet$Pair-wise test > For term: Dist > For pairs of levels of factor: Dist).
The file of results will contain the same preliminary information regarding the design and other choices as was seen for the main PERMANOVA test, but then the individual comparisons, using pseudo-t and with P-values by permutation, are given for each pair of levels of the factor. Generally speaking, as with the F ratio, the larger the t statistic, the greater the evidence against the null hypothesis of no difference in community structure between the two groups.
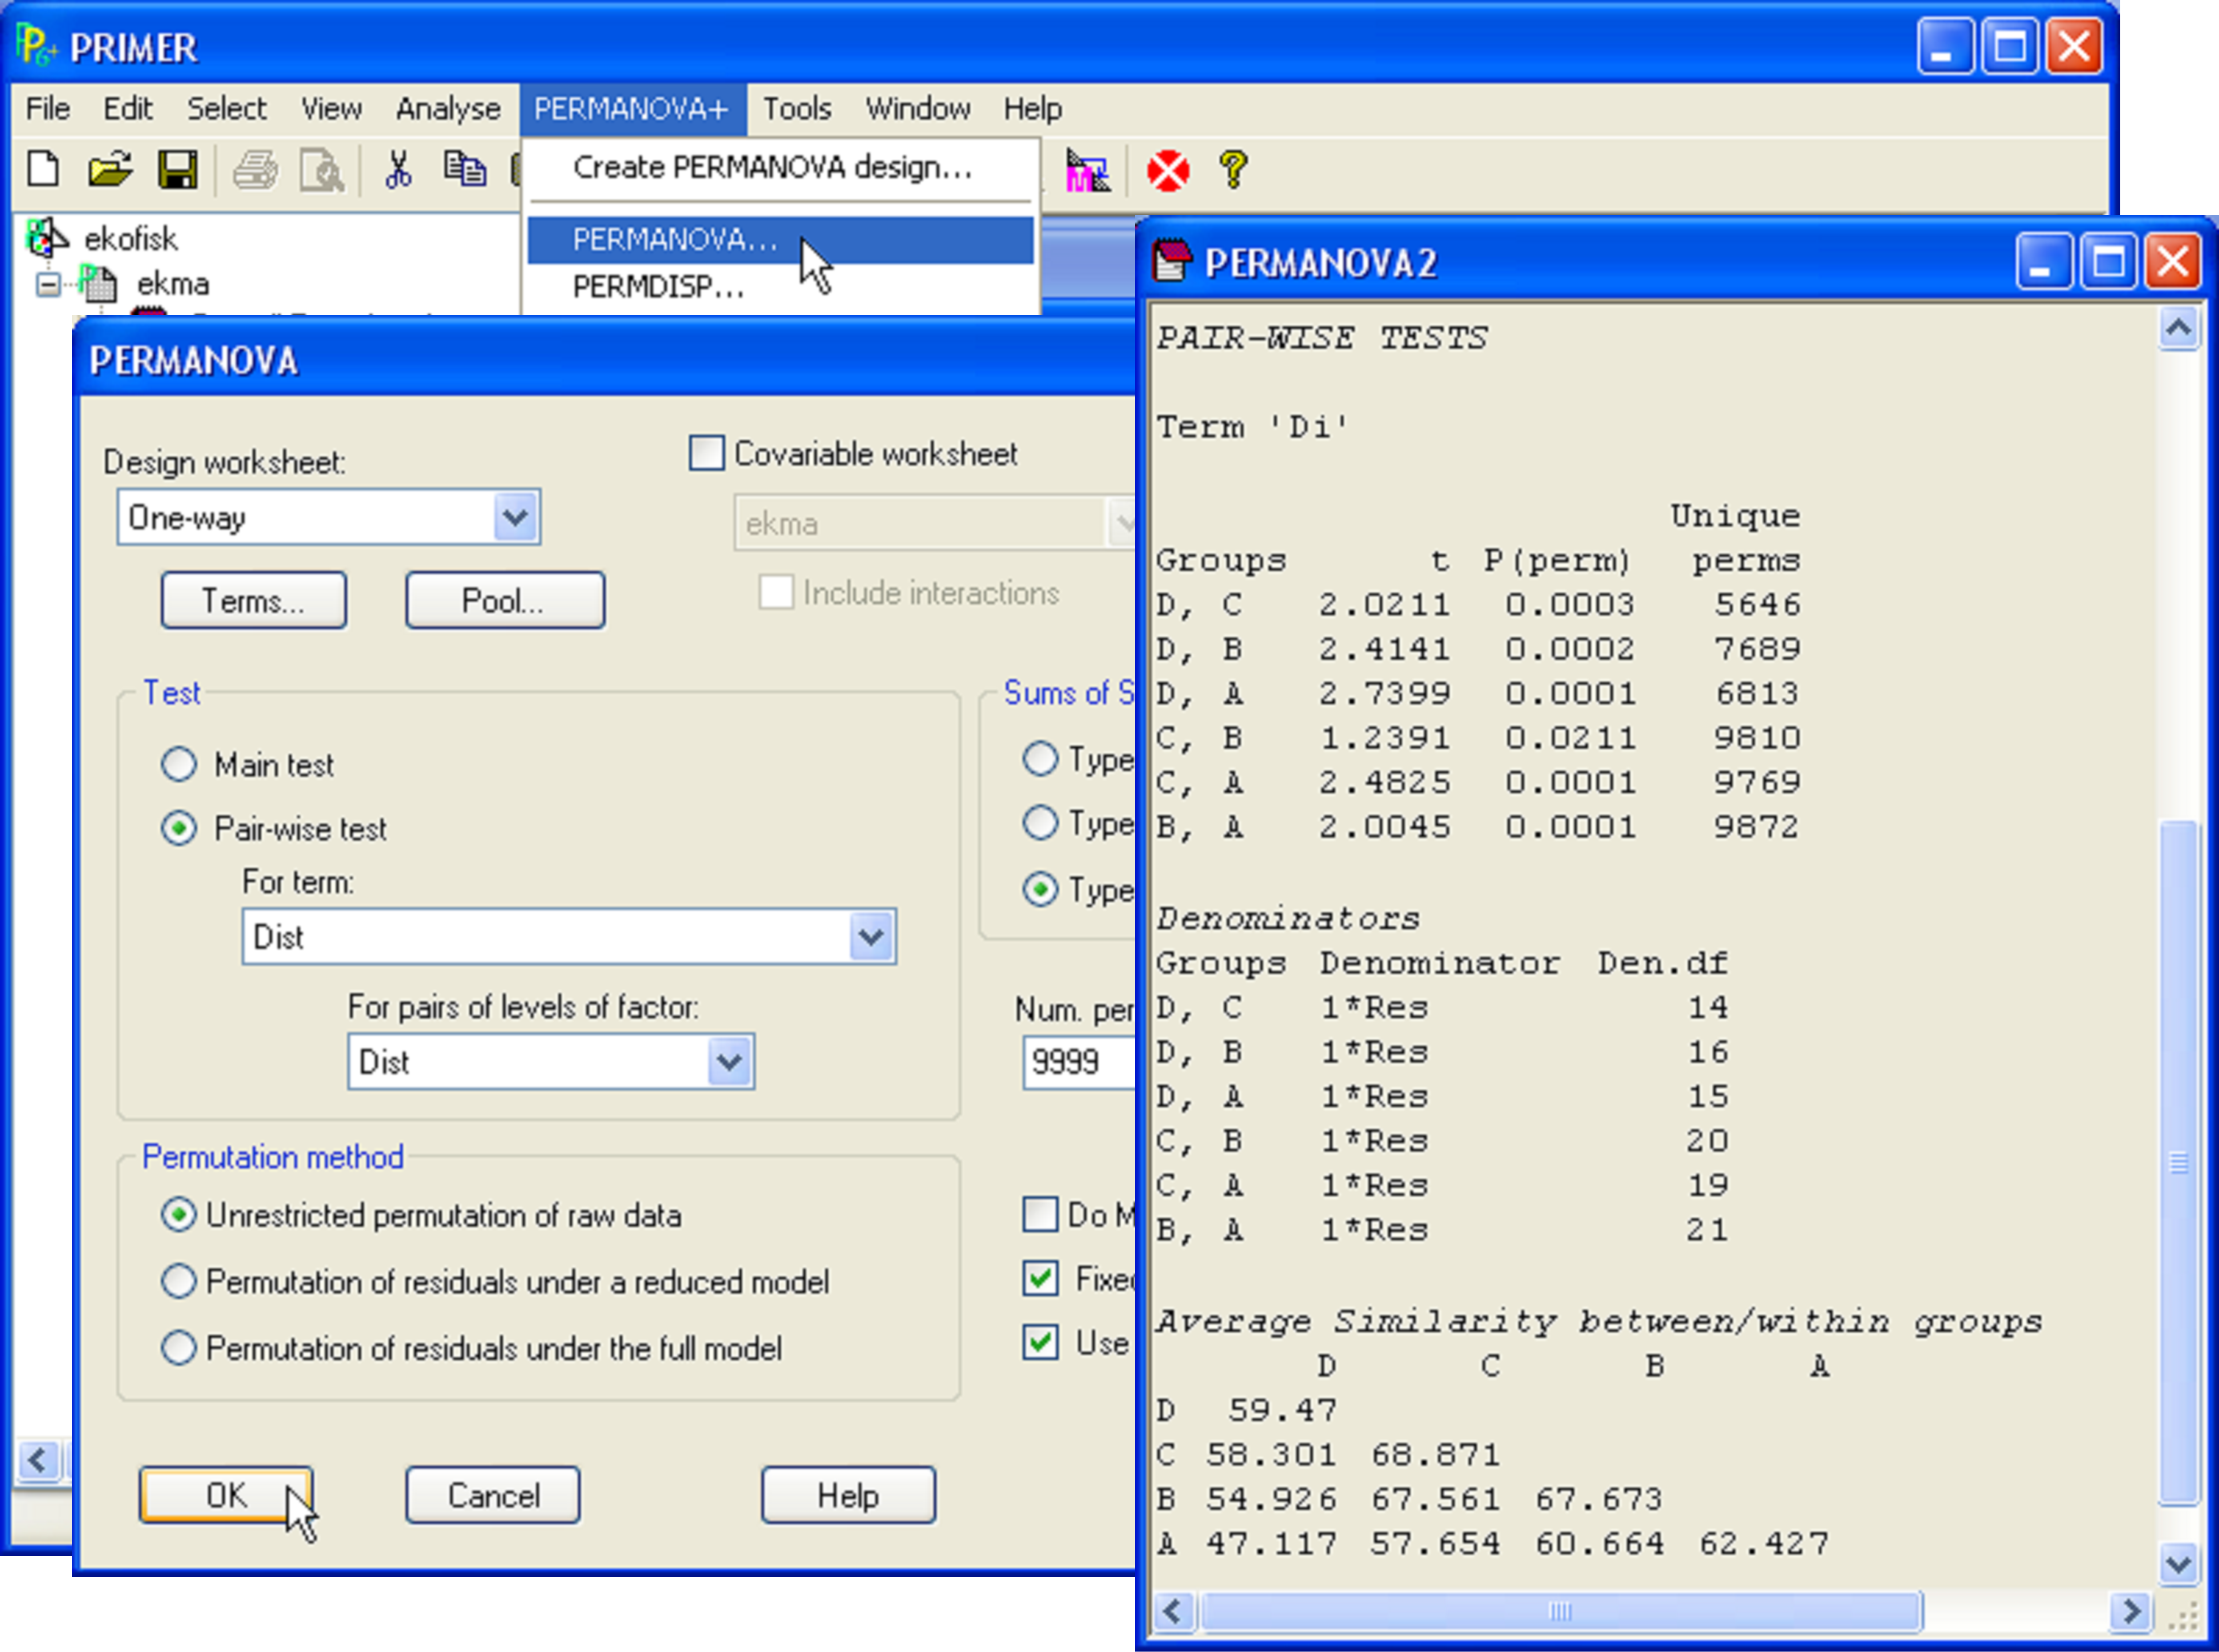 Fig. 1.11. Pair-wise tests among groups for the Ekofisk macrofauna.
For the Ekofisk example, there is fairly strong evidence to suggest that all of the groups differ from one another (P < 0.001 for most comparisons, Fig. 1.11). However, the evidence against the null hypothesis for the comparison of group B with group C is weaker than the rest (Fig. 1.11, t = 1.24, P = 0.021).
A relevant point to note here is that no corrections for multiple comparisons have been made to any of these tests. It is a well-known phenomenon in statistics that the more tests you do, the greater your chance of rejecting one or more null hypotheses simply by chance. For example, if we were to perform 20 tests using an a priori significance level of 0.05, we would expect to reject a true null hypothesis (i.e., to get a P-value smaller than 0.05) in one of those 20 tests by chance alone. However, the permutation P-values do provide an exact test of each individual null hypothesis of interest. In contrast, most ad hoc experiment-wise corrections that could be used here (such as Bonferroni) are inexact and known to be overly conservative (e.g., Day & Quinn (1989) ). Thus, our philosophy (here and elsewhere) is to report the exact permutation P-values directly and to let the user decide whether or not to apply any additional corrections.
We recommend that one should consider the set of tests as a whole, in probabilistic terms. If there are a groups, then there will be a(a – 1)/2 tests. For the Ekofisk example, this is 4(4 – 1)/2 = 6 tests. Clearly, in the present case, if all null hypotheses were true, it would be highly unlikely to get six out of six P-values less than 0.05 (as we have done) simply by chance! If, however, the number of tests were very large, with few small P-values encountered (e.g., if one obtained only one or two P-values less than 0.05 out of 20 or so tests), then one might choose to apply a formal correction or, at the very least, exercise caution in interpreting the results16.
The routine for pair-wise tests also provides a triangular matrix containing the average resemblances between samples that are either in the same group (along the diagonal) or in different groups (sub-diagonal elements, Fig. 1.11). This identifies the relative sizes of average similarities (or dissimilarities) between each pair of groups in the multivariate space, and also helps (along with the formal assessment provided in the PERMDISP routine, see chapter 2) to identify potential differences among the groups in terms of their within-group variability.
16 See Wheldon, Anderson & Johnson (2007) , in which an exact correction for family-wise error across a large set of non-independent simultaneous multivariate permutation tests was achieved using the permutation distributions.