2.8 Choice of measure
An extremely important point is that the test of dispersion is going to be critically affected by the transformation, standardisation and resemblance measure used as the basis of the analysis. It is pretty well appreciated by most practitioners that transforming the data has important effects on relative dispersions. Consider the fact that one of the common remedies to heterogeneity of variances in the analysis of univariate data is indeed to perform an appropriate transformation (e.g., Box & Cox (1964) ). Such a transformation is (usually) designed explicitly to make the data more normally distributed (less skewed), to remove intrinsic mean-variance relationships (if any), and to render the variances essentially homogeneous among groups. Although the consequences of the use of transformations on resulting inferences is rarely articulated explicitly ( McArdle & Anderson (2004) ), such an approach has merit and is widely used in univariate analyses. Thus, it is not at all difficult to understand that transformations will also affect relative dispersions in multivariate space.
Much less well appreciated is the extent to which the choice of resemblance measure can affect perceived patterns and results regarding relative dispersions among groups. For example, consider the analysis of the percentage cover data on corals from South Tikus Island. The Bray-Curtis measure is known to display erratic behaviour for sparse data such as these ( Clarke, Somerfield & Chapman (2006) ). We might consider an analysis of the same dataset using some other measure, such as a Euclidean or Manhattan distance on log(x+1)-transformed cover values. Such an approach could be considered reasonable on the grounds that the transformation will appropriately reduce the effects of large cover values, and a measure such as the Manhattan distance does not exclude joint absence information. In the present context, the joint absences of coral species (having been killed by bleaching) might indeed be considered to indicate similarity between samples. An MDS of the samples on the basis of the Manhattan measure on log(x+1)-transformed values shows a dramatically different pattern to what was shown using the Bray-Curtis measure (cf. Fig. 2.7 with Fig. 2.5). The points corresponding to samples from 1983 form a very tight cluster, samples from 1985 are a bit more dispersed, and the dispersion among samples from 1981 are much more dispersed (Fig. 2.7). The results of the PERMDISP analysis indicate that these differences in relative within-group dispersions among the groups (1981 > 1985 > 1983) are all highly statistically significant (see Fig. 2.6 above).
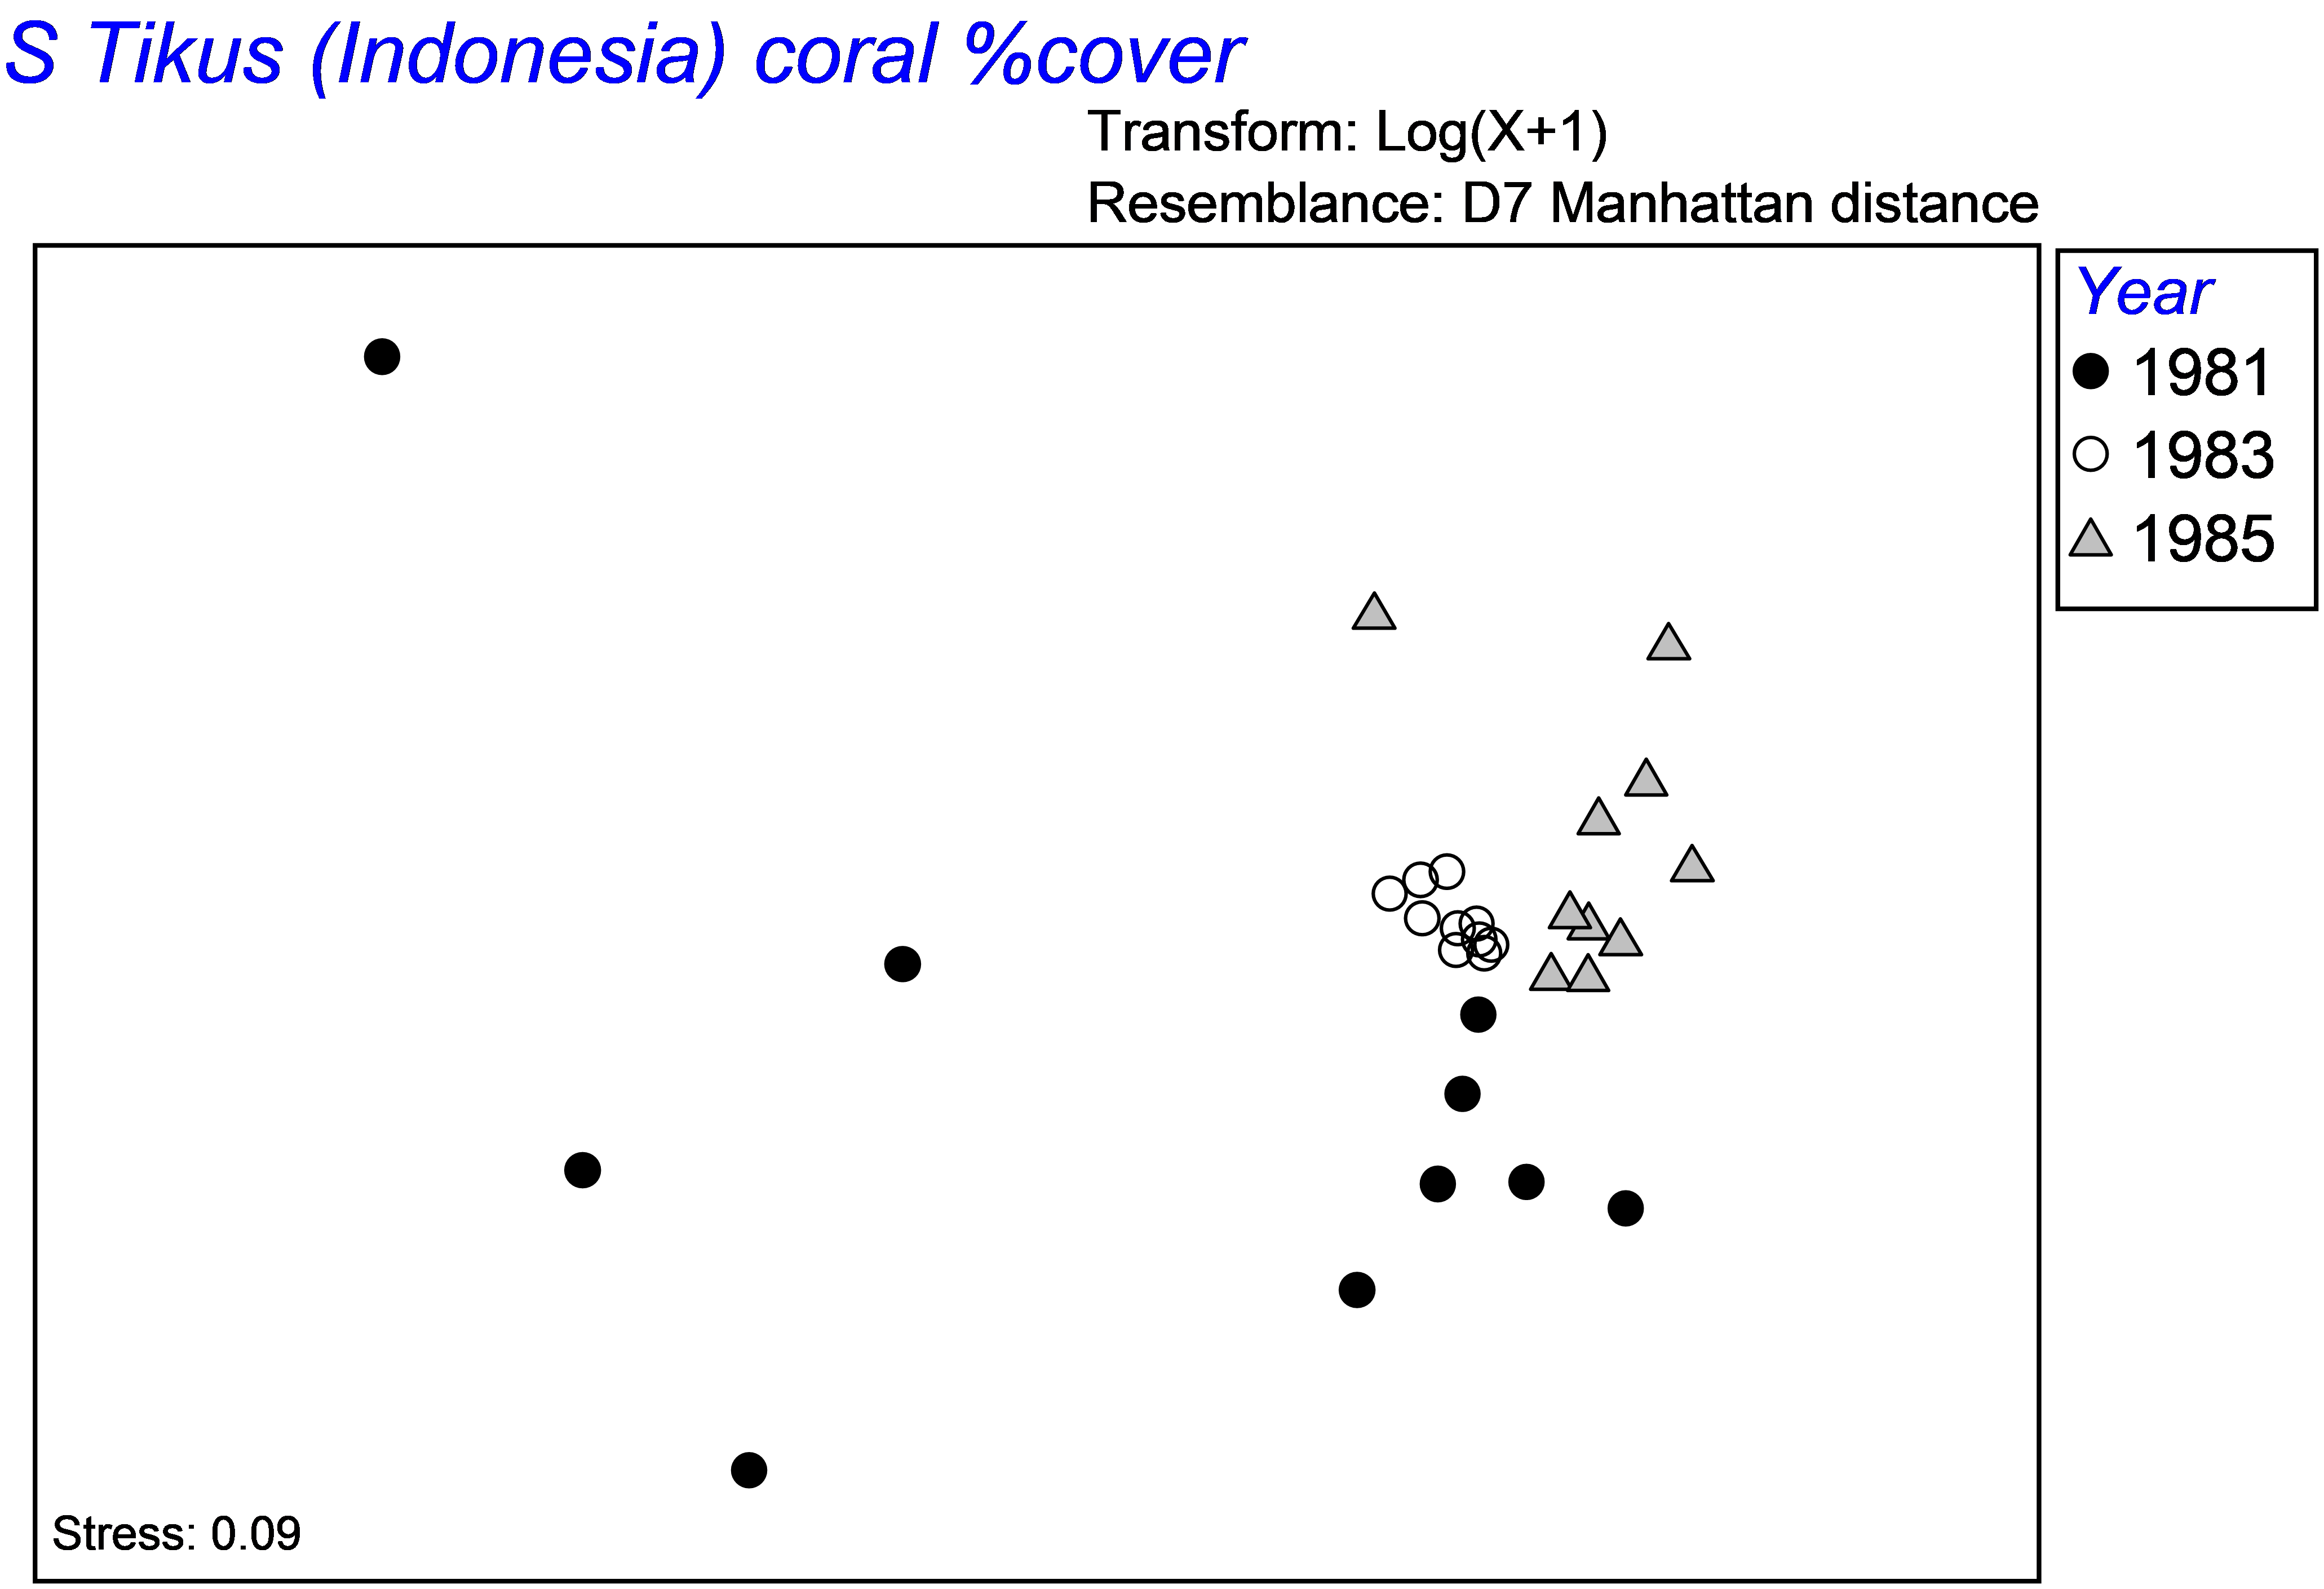
Fig. 2.7. MDS of coral assemblages from South Tikus Island in each of three years on the basis of Manhattan distances of log(x+1)-transformed percentage cover.
What we mean when we say “heterogeneity in multivariate dispersions” therefore must be qualified by reference to the particular resemblance measure we have chosen to use. Clearly, in the present case, the inclusion or exclusion of joint absence information can dramatically alter the results. In this particular example, the effects of transformations were actually quite modest by comparison56. Of course, the nature of the patterns obtained in any particular case will depend, however, on the nature of the data. In some cases, the transformation chosen will have dramatic effects.
There are many new areas to explore concerning the effects of different resemblance measures and transformations on relative within-group dispersions in different situations. The point is: be careful to define what is meant by “variability in assemblage structure” and realise that this is specific to the measure you have chosen to use and the nature of your particular data. Also, if you are intending to analyse the data using PERMANOVA as well, then of course it makes sense to choose the same transformation/standardisation/resemblance measure for the PERMDISP routine as were used for the PERMANOVA in order to obtain reasonable joint interpretations and inferences.
In addition, as PERMANOVA uses common measures of variability in the construction of F-ratios for tests, homogeneity is definitely implicit in the analysis of a resemblance matrix using PERMANOVA. Thus, after calculating a resemblance matrix which captures the desired ecological/community properties of the data, analysis by PERMDISP and visual assessment in ordination plots will highlight potential heterogeneities that could lead to a suitable degree of caution in the interpretation of results from a PERMANOVA model of the variation. This is not to say that a non-significant result using PERMDISP is an absolute requirement before using PERMANOVA; it is expected that PERMDISP will be powerful enough to detect small differences in dispersion that may not affect PERMANOVA adversely. However, the closer one can get to stabilising the relative dispersions among groups (or among cells in higher-way designs, etc.), the more valid and clear will be the interpretations from a PERMANOVA analysis.
56 Results obtained using Bray-Curtis on log(x+1)-transformed data are similar to what is obtained in Fig. 2.5 and results obtained using Manhattan on untransformed data are similar to what is obtained in Fig. 2.7 (try it)!