1.26 Testing the design
Given the fact that so many important aspects of the results (pseudo-F ratios, P-values, power, the inference space, etc.) depend so heavily on the experimental design (information given in the design file), one might wish to examine the qualities of various designs, even before embarking on the serious task of actually gathering the data. In PERMANOVA+, a special routine is provided that allows the user to explore different designs without actually analysing data. All that is required to perform a test of a given design is (i) a (dummy) data worksheet file possessing relevant factor information and (ii) a design file. The dummy data file with factor information is needed in order to identify the number of replicates per cell and how many levels there are for all of the factors.
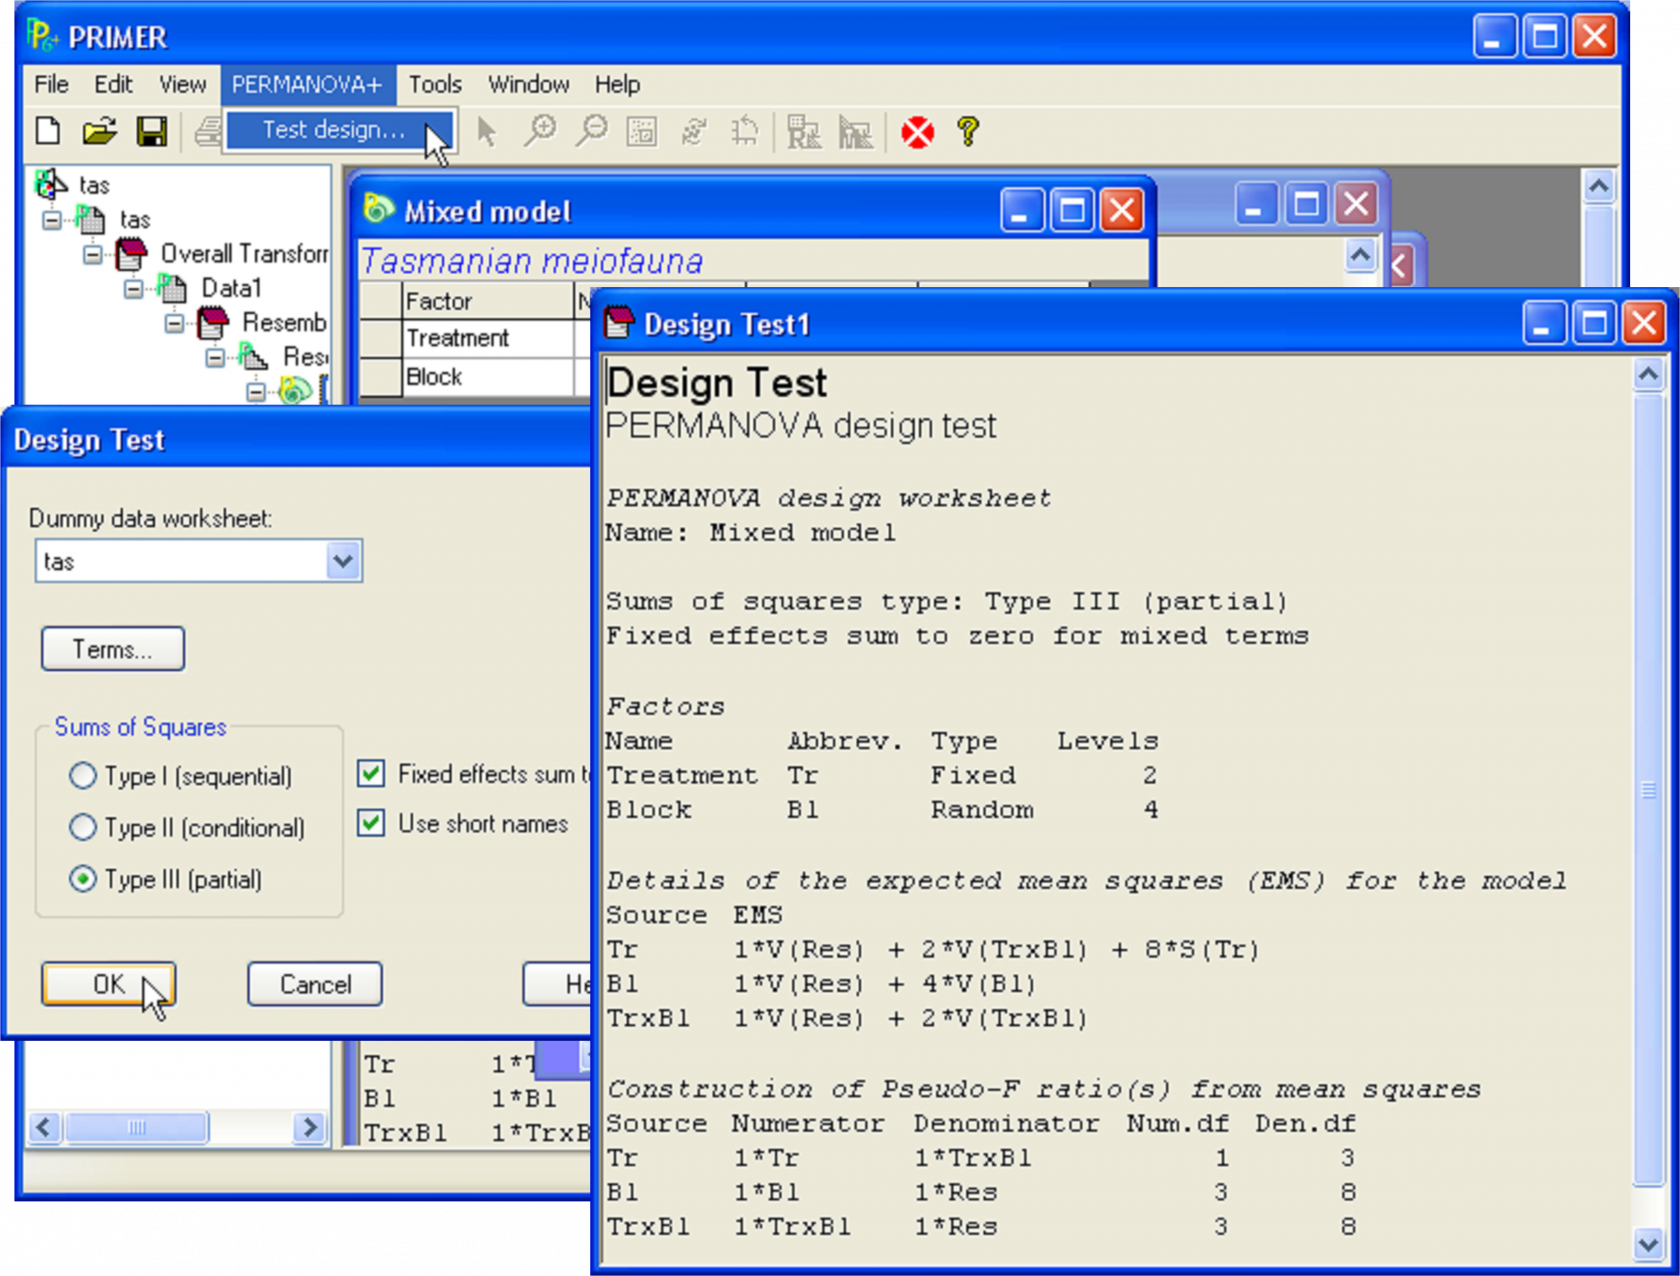
For example, highlight the design file Mixed model in the tas.pwk file. Choose PERMANOVA+ > Test design > (Dummy data worksheet: tas) & (Sums of Squares $\bullet$Type III (partial)). The results will include details of the expected mean squares (EMS) for each term in the model and the construction of the pseudo-F ratio for each term, including the degrees of freedom for each test (Fig. 1.25). This allows the user to trial different experimental designs and to consider the best options, for relevant statistical inferences and for assessing power (on the basis of denominator degrees of freedom) for given hypotheses of interest. For example, in the output for the Tasmanian meiofauna, one can see that the construction for the pseudo-F ratio for ‘Tr’ (the most important test of interest to the experimenter here) is $F _{Tr} = MS _ {Tr} / MS _ {Tr \times Bl}$. Therefore, a more powerful experimental design for the test of disturbance effects (the term ‘Tr’) would actually be obtained by increasing the number of blocks in the experiment (and thus, the degrees of freedom associated with the term ‘TrxBl’), rather than increasing the number of replicates per block (residual degrees of freedom), which would be unlikely to have any immediate effect on the test of $F _ {Tr}$.
 Fig. 1.25. Testing the two-way mixed model design for the Tasmanian meiofauna.
