10.2 Examples
Multivariate examples
Nutrient-enrichment experiment
In the soft-bottom mesocosms at Solbergstrand, Norway {N}, box-cores of sublittoral sediment were subjected to three levels of particulate organic enrichment (L = low dose, H = high dose and C = control), there being four replicates from each treatment. After 56 days the meiobenthic communities were analysed. Fig 10.2 shows that, for the copepods, there were clear differences in community structure between treatments at the species level, which were equally evident when the species data were aggregated into genera and families. (Indeed, at the family level the configuration is arguably more linearly related to the pollution gradient than at the species level).
Loch Linnhe macrofauna
MDS ordinations of the Loch Linnhe macrobenthos are given in Fig. 10.3, using both double square root and untransformed abundance data. Information on the time-course of pollution events and changes in diversity are given in Fig. 10.7 (top left). The ordinations have been performed separately using all 111 species, the 45 families and the 9 phyla. In all ordinations there is a separation to the right of the years 1970, 1971 and 1972 associated with increasing pollution levels and community stress, and a return to the left in 1973 associated with reduced pollution levels and community stress. This pattern is equally clear at all levels of taxonomic aggregation. Again, the separation of the most polluted years is most distinct at the phylum level, at least for the double square root transformed data (and the configuration is more linear with respect to the pollution gradient at the phylum level for the untransformed data).
Amoco-Cadiz oil-spill
Macrofauna species were sampled at station ‘Pierre Noire’ in the Bay of Morlaix on 21 occasions between April 1977 and February 1982, spanning the period of the wreck of the ‘Amoco-Cadiz’ in March 1978. The sampling site was some 40km from the initial tanker disaster but substantial coastal oil slicks resulted. The species abundance MDS has been repeated with the data aggregated into five phyla: Annelida, Mollusca, Arthropoda, Echinodermata and ‘others’ (Fig. 10.4). The analysis of phyla closely reflects the timing of pollution events, the configuration being slightly more linear than in the species analysis. All pre-spill samples (A-E) are in the top left of the configuration, the immediate post-spill sample (F) shifts abruptly to the bottom right after which there is a gradual recovery in the pre-spill direction. Note that in the species analysis, although results are similar, the immediate post-spill response is rather more gradual. The community response at the phylum level is remarkably clear.
Indonesian reef corals
The El Niño of 1982-3 resulted in extensive bleaching of reef corals throughout the Pacific. Fig. 10.5 shows the coral community response at South Pari Island over six years in the period 1981-1988, based on ten replicate line transects along which coral species cover was determined. Note the immediate post-El Niño location shift on the species MDS and a circuitous return towards the pre-El Nino condition. This is closely reflected in the genus level analysis.
Ekofisk oil-platform macrobenthos
Changes in community structure of the soft-bottom benthic macrofauna in relation to oil drilling activity at the Ekofisk platform in the North Sea {E} have been studied by
Gray, Clarke, Warwick et al. (1990)
and
Warwick & Clarke (1991)
. The positions of the 39 sampling stations around the rig are coded by different symbol and shading conventions in Fig. 10.6a, according to their distance from the centre of drilling activity at that time. In the MDS species abundance analysis (Fig. 10.6b), community composition in all of the zones is distinct, and there is a clear gradation of change from the (black circle) inner to the (open triangle) outer zones. Formal significance testing (using the methods of Chapter 6) confirms statistically the differences between all zones. The MDS has been repeated with the species data aggregated into families (Fig. 10.6c) and phyla (Fig. 10.6d). The separation of sites is still clear, and pairwise comparisons confirm the statistical significance of differences between all zones, even at the phylum level, which does show some deterioration of the pattern. This is in contrast to (species-level) univariate and graphical/distributional measures, in which only the inner zone (less than 250m from the rig) was significantly different from the other three zones (see Chapter 14). Thus, phylum level analyses are again shown to be surprisingly sensitive in detecting pollution-induced community change, and little information at all is lost by working at the family level.
Graphical examples
Loch Linnhe macrofauna
ABC plots for the Loch Linnhe macrobenthos species data are given in Chapter 8, Fig. 8.7, where the performance of these curves with respect to the time-course of pollution events is discussed. In Fig. 10.7 the species data are aggregated to family level, and the curves are virtually identical to the species level analysis, so that there would have been no loss of information had the samples only been sorted originally into families.
Similar results were produced by replotting the ABC curves for the Garroch Head sewage sludge dumping ground macrobenthos {G} (Fig. 8.8) at the family level ( Warwick (1988b) ).
Univariate example
Indonesian reef corals
Fig. 10.8 shows results from another survey of 10 replicate line transects for coral cover over the period 1981-1988, in this case at South Tikus Island, Indonesia {I}. Note the similarity of the species and genus analyses for the number of taxa and Shannon diversity, with an immediate post-El Niño drop and subsequent suggestion of partial recovery.
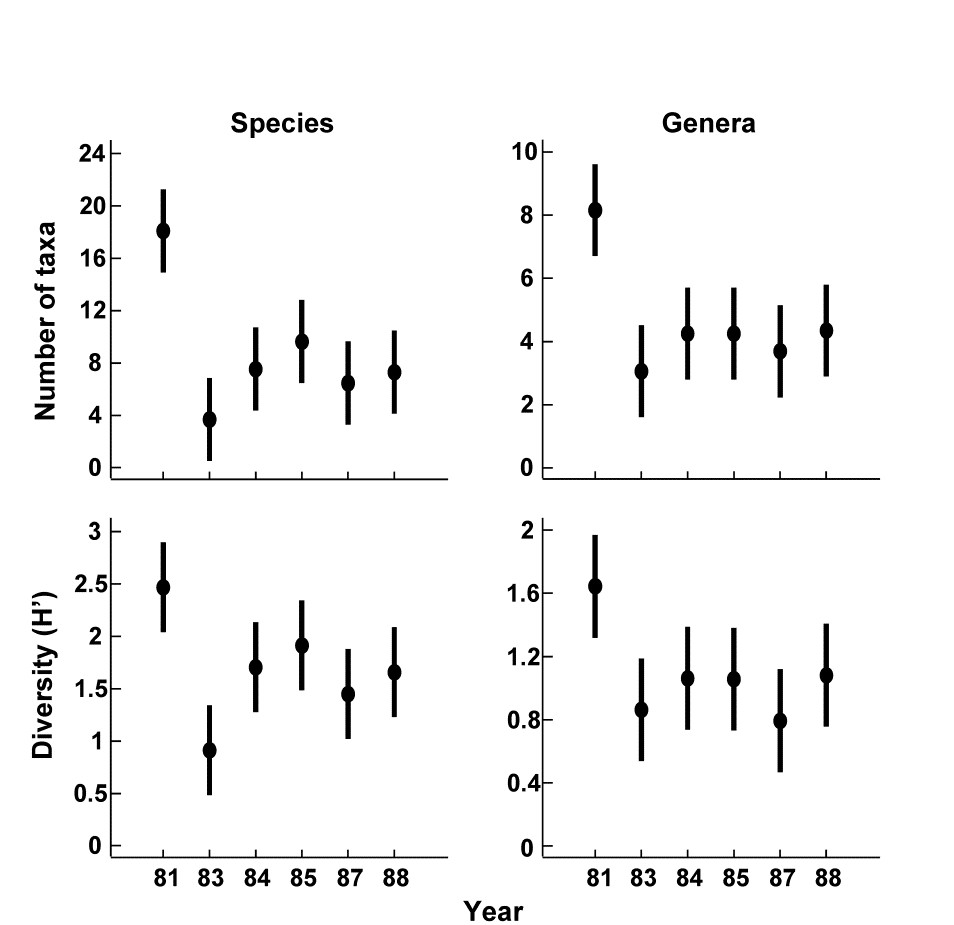
Fig. 10.8. Indonesian reef corals {I}. Means and 95% confidence intervals for number of taxa and Shannon diversity at South Tikus Island, showing the impact and partial recovery from the 1982–3 El Niño. Species data (left) have been aggregated into genera (right).