17.2 Average taxonomic diversity and distinctness
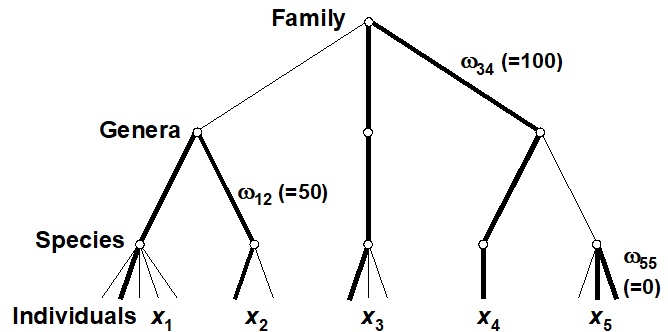
Two measures, which address some of the problems identified with species richness and the other diversity indices, are defined by Warwick & Clarke (1995b) . They are based not just on the species abundances (denoted by $x _ i$, the number of individuals of species i in the sample) but also the taxonomic distances ($\omega _ {ij}$), through the classification tree, between every pair of individuals (the first from species i and the second from species j). For a standard Linnean classification, these are discrete distances, the simple tree below illustrating path lengths of zero steps (individuals from the same species), one step (same genus but different species) and two steps (different genera)¶. Clarke & Warwick (1999) advocate a simple linear scaling whereby the largest number of steps in the tree (two species at greatest taxonomic distance apart) is set to $\omega = 100$. Thus, for a sample consisting only of the 5 species shown, the path between individuals in species 3 and 4 is $\omega _ {34} = 100$, between species 1 and 2 is $\omega _ {12} = 50$, between two individuals of species 5 is $\omega _ {55} = 0$, etc.
Average taxonomic diversity of a sample is then defined ( Warwick & Clarke (1995b) ) as: $$ \Delta = \left[ \sum \sum _ {i < j} \omega _ {ij} x _ i x _ j \right] / \left[ N (N – 1)/2 \right] \tag{17.1} $$
where the double summation is over all pairs of species i and j (i,j = 1, 2, …, S; i<j), and $N = \sum _ i x _ i$, the total number of individuals in the sample. $\Delta$ has a simple interpretation: it is the average ‘taxonomic distance apart’ of every pair of individuals in the sample or, to put it another way, the expected path length between any two individuals chosen at random.
Note also that when the taxonomic tree collapses to a single-level hierarchy (all species in the same genus, say), $\Delta$ becomes
$$ \Delta ^ \circ = \left[ 2 \sum \sum _ {i < j} p _i p _ j \right] / ( 1 - N ^ {-1} ) = \left( 1 - \sum _ i p _ i ^ 2 \right) / ( 1 - N ^ {-1} ) \tag{17.2}$$ $ \hspace{117pt}$ where $p _ i = x _ i / N $
which is a form of Simpson diversity. The Simpson index is actually defined from the probability that any two individuals selected at random from a sample belong to the same species ( Simpson (1949) ). $\Delta$ is therefore seen to be a natural extension of Simpson, from the case where the path length between individuals is either 0 (same species) or 100 (different species) to a more refined scale of intervening relatedness values (0 = same species, 20 = different species in the same genera, 40 = different genera but same family, etc).† It follows that $\Delta$ will often track Simpson diversity fairly closely. To remove the dominating effect of the species abundance distribution {$x _ i$}, leaving a measure which is more nearly a pure reflection of the taxonomic hierarchy, Warwick & Clarke (1995b) proposed dividing $\Delta$ by the Simpson index $\Delta ^ \circ$ to give average taxonomic distinctness $$ \Delta ^ \ast = \left[ \sum \sum _ {i < j} \omega _ {ij} x _ i x _ j \right] / \left[\sum \sum _ {i < j} x _ i x _ j \right] \tag{17.3} $$ Another way of thinking of this is as the expected taxonomic distance apart of any two individuals chosen at random from the sample, provided those two individuals are not from the same species.
A further form of the index, exploited greatly in what follows, takes the special case where quantitative data is not available and the sample consists simply of a species list (presence/absence data). Both $\Delta$ and $\Delta ^ \ast$ reduce to the same coefficient
$$ \Delta ^ + = \left[ \sum \sum _ {i < j} \omega _ {ij} \right] / \left[ S (S - 1) / 2 \right] \tag{17.4} $$
where S, as usual, is the observed number of species in the sample and the double summation ranges over all pairs i and j of these species (i<j). Put simply, the average taxonomic distinctness (AvTD) $\Delta ^ +$ of a species list is the average taxonomic distance apart of all its pairs of species. This is a very intuitive definition of biodiversity, as average taxonomic breadth of a sample.
Sampling properties
For quantitative data, repeating the pairwise exercise (Fig. 17.1) of random subsampling of individuals from a single, large sample, Fig. 17.2a and b show that both taxonomic diversity ($\Delta$) and average taxonomic distinctness ($\Delta ^ \ast$) inherit the sample-size independence seen in the Simpson index, from which they are generalised. Clarke & Warwick (1998b) formalise this result by showing that, whatever the hierarchy or subsample size, $\Delta$ is exactly unbiased and $\Delta ^ \ast$ is close to being so (except for very small subsamples). For non-quantitative data (a species list), the corresponding question is to ask what happens to the values of $\Delta ^ +$ for random subsamples of a fixed number of species drawn from the full list. Fig. 17.2c demonstrates that the mean value of $\Delta ^ +$ is unchanged, its exact unbiasedness in all cases again being demonstrated in Clarke & Warwick (1998b) . This lack of dependence of $\Delta ^ +$ (in mean value) on the number of species in the sample has far-reaching consequences for its use in comparing historic data sets and other studies for which sampling effort is uncontrolled, unknown or unequal.
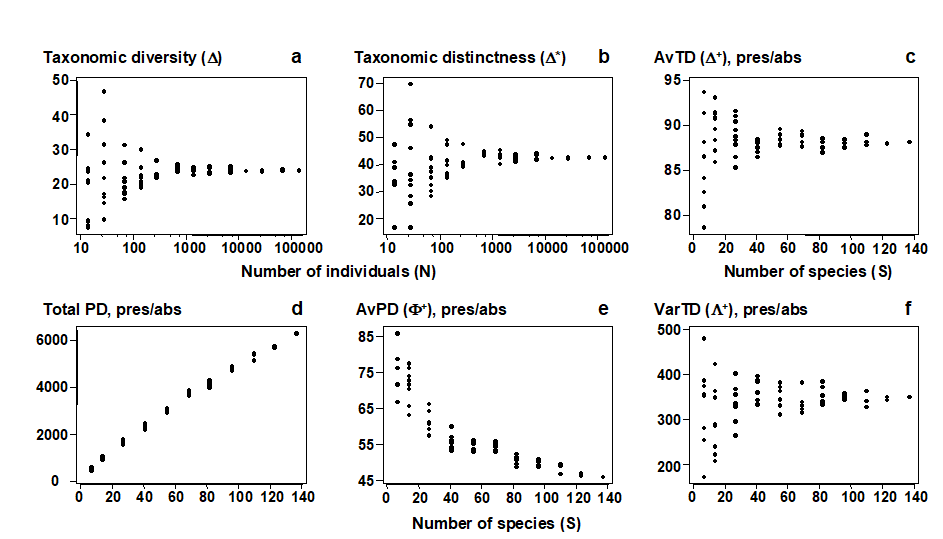
Fig. 17.2. Amoco-Cadiz oil spill {A}, pooled pre-impact data. a), b) Quantitative indices (y-axis): Average taxonomic diversity ($\Delta$) and distinctness ($\Delta ^ \ast$) for random subsets of fixed numbers of individuals (x-axis, logged), drawn randomly from the pooled sample, as in Fig. 17.1. c)–f) List-based (presence/absence) indices (y-axis): Average taxonomic distinctness ($\Delta ^ +$), total phylogenetic diversity (PD), average phylogenetic diversity ($\Phi ^ +$) and Variation in taxonomic distinctness ($\Lambda ^ +$), for random subsets of fixed numbers of species (x-axis) drawn from the full species list for the pooled sample. The sample-size independence of TD-based indices is clear, contrasting with PD and most standard diversity measures (Fig. 17.1).
¶ The principle extends naturally to a phylogeny with continuously varying branch lengths and even, ultimately, to a molecular-based genetic distance between individuals (of the same or different species), see Clarke & Warwick (2001) , Fig. 1. And one of the interesting further developments is to apply the ideas of this chapter to a tree which reflects functional relationships among species, leading to functional diversity measures ( Somerfield, Clarke, Warwick et al. (2008) ).
† In addition, there is a relationship between $\Delta$ and Simpson indices computed at higher taxonomic levels, see Shimatani (2001) . In effect, $\Delta$ is a (weighted) mean of Simpson at all taxonomic levels.