13.5 Attributes and recommendations
Attributes
Species abundance data are by far the most commonly used in environmental impact studies at the community level. However, the abundance of a species is perhaps the least ecologically relevant measure of its relative importance in a community, and we have already seen in Chapter 10 that higher taxonomic levels than species may be sufficient for environmental impact analyses. So, when planning a survey, consideration should be given not only to the number of stations and number of replicates to be sampled, but also to the level of taxonomic discrimination which will be used, and which measure(s) of the relative importance of these taxa will be made.
Abundance, biomass and production
As a measure of the relative ecological importance for soft-sediment and water-column sampling of species, biomass is better than abundance, and production in turn is better than biomass. However, the determination of annual production of all species within a community over a number of sites or times would be so time consuming as to be completely impracticable.¶ We are therefore left with the alternatives of studying abundances, biomasses, or both. Abundances are marginally easier to measure, biomass may be a better reflection of ecological importance, and measurement of both abundance and biomass opens the possibility of comparing species-by-sites matrices based on these two different measures (e.g. by the ABC method discussed in Chapter 8).
In practice, multivariate analyses of abundance and biomass data often give remarkably similar results, despite that fact that the species mainly responsible for discriminating between stations are usually different. In Fig. 13.8, for example, the Frierfjord macrobenthos MDS configurations for abundance and biomass are very similar but it is small polychaete species which are mainly responsible for discriminating between sites on the basis of abundance, and species such as the large echinoid Echinocardium cordatum which discriminate the sites on the basis of biomass.
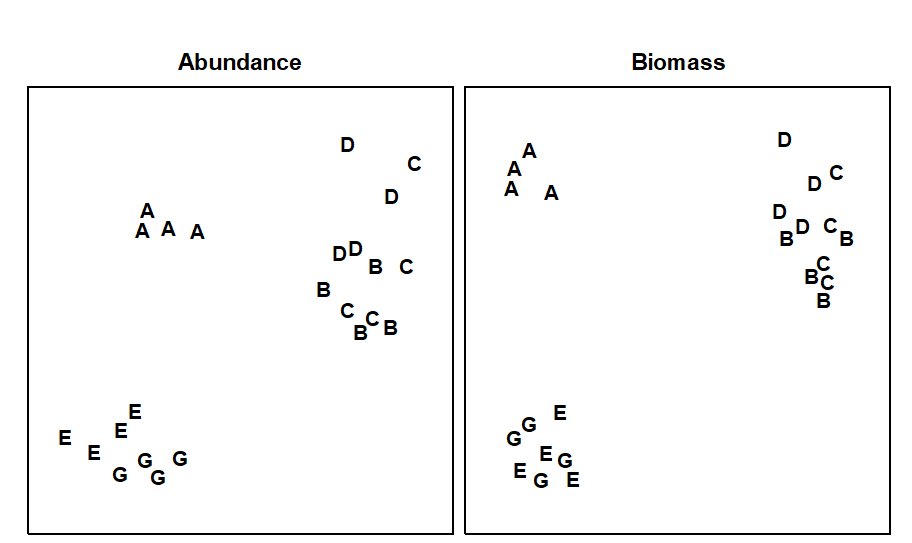
Fig. 13.8. Frierfjord macrofauna {F}. MDS ordinations for abundance and biomass of the 4 replicates at each of the 6 sites (stress = 0.10, 0.08).
Species or higher taxa
We have already seen in Chapter 10 that, in many pollution-impact studies, it has been found for both graphical and multivariate analyses that there is surprisingly little loss of information when the species data are aggregated to higher taxa, e.g. genera, families or sometimes even phyla. For the detection of pollution impact, initial collection of data at the level of higher taxa would result in a considerable saving of time (and cost) in the analysis of samples. Such a strategy would, of course, be quite inappropriate if the objective were to be differently defined, for example, the quantification of biodiversity properties.
Recommendations
It is difficult to give firm recommendations as to which components or attributes of the biota should be studied, since this depends on the problem in hand and the expertise and funds available. In general, however, the wider the variety of components and attributes studied, the easier the results will be to interpret. A broad approach at the level of higher taxa is often preferable to a painstakingly detailed analysis of species abundances. If only one component of the fauna is to be studied, then consideration should be given to working up a larger number of stations/replicates at the level of higher taxa in preference to a small number of stations at the species level. Of course, a large number of replicated stations at which both abundance and biomass are determined at the species level is always the ideal!
¶ Although relative ‘production’ of species can be approximated using empirical relationships between biomass, abundance and production, and these ‘production’ matrices subjected to multivariate analysis, see Chapter 15.