14.2 Examples 1, 2 and 3
Example 1: Macrobenthos from Frierfjord/Langesundfjord, Norway
As part of the GEEP/IOC Oslo Workshop, macrobenthos samples were collected at a series of six stations in Frierfjord/Langesundfjord {F}, station A being the outermost and station G the innermost (station F was not sampled for macrobenthos). For a map of the sampling locations see Fig. 1.1.
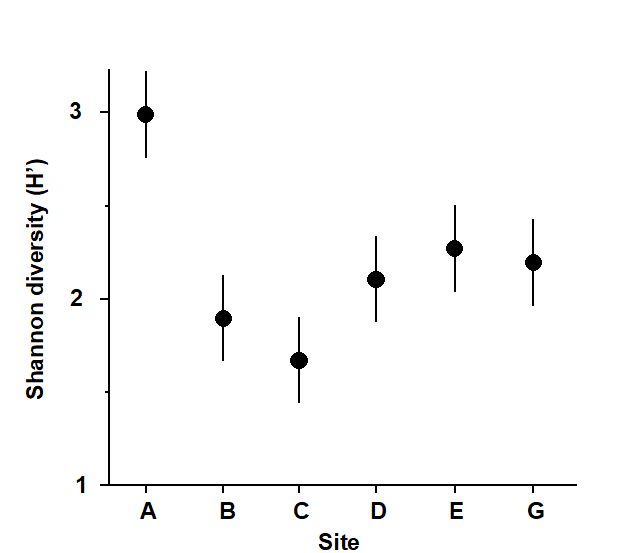
Fig. 14.1. Frierfjord macrobenthos {F}. Shannon diversity (mean and 95% confidence intervals) for each station.
Univariate indices
Site A had a higher species diversity and site C the lowest but the others were not significantly different (Fig. 14.1).
Graphical/distributional plots
ABC plots indicated that stations C, D and E were most stressed, B was moderately stressed, and A and G were unstressed (Fig. 14.2).
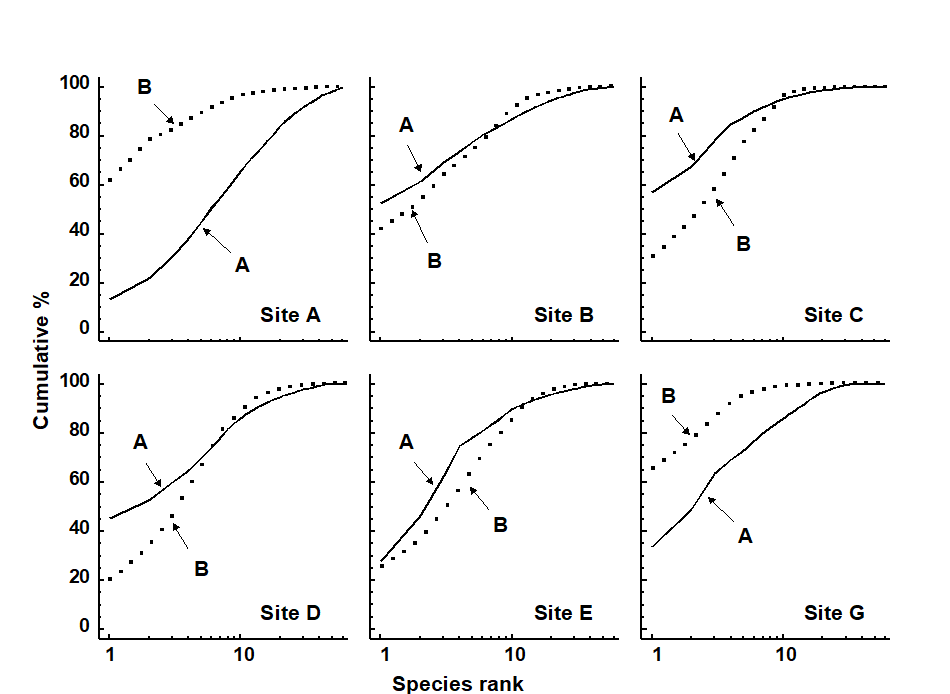
Fig. 14.2. Frierfjord macrobenthos {F}. ABC plots based on the totals from 4 replicates at each of the 6 sites. Solid lines: abundances; dotted lines: biomass.
Multivariate analysis
An MDS of all 24 samples (4 replicates at each station), supported by the ANOSIM test, showed that only stations B and C were not significantly different from each other (Fig. 14.3). Gray, Aschan, Carr et al. (1988) show that the clusters correlate with water depth rather than with measured levels of anthropogenic variables such as hydrocarbons or metals.
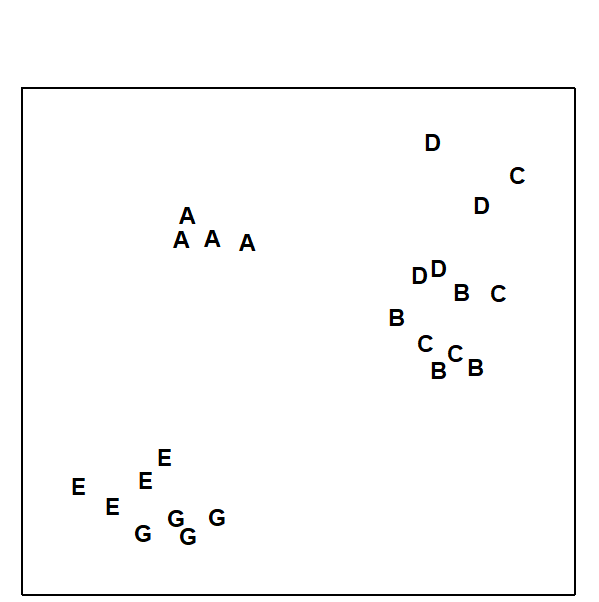
Fig. 14.3. Frierfjord macrobenthos {F}. MDS of 4 replicates at each of sites A–E, G, from Bray-Curtis similarities on 4th root-transformed counts (stress = 0.10).
Conclusions
The MDS was much better at discriminating between stations than the diversity measure, but perhaps more importantly, sites with similar univariate or graphical/ distributional community structure did not cluster together on the MDS. For example, diversity at E was not significantly different from D but they are furthest apart on the MDS; conversely, E and G had different ABC plots but clustered together. However, B, C and D all have low diversity and the ABC plots indicate disturbance at these stations. The most likely explanation is that these deep-water stations are affected by seasonal anoxia, rather than anthropogenic pollution.
Example 2: Macrobenthos from the Ekofisk oilfield, N. Sea
Changes in community structure of the soft-bottom benthic macrofauna in relation to oil drilling activity at the Ekofisk platform in the North Sea {E} have been described by Gray, Clarke, Warwick et al. (1990) . The positions of the sampling stations around the rig are coded by shading and symbol conventions in Fig. 14.4a, according to their distance from the active centre of drilling activity at the time of sampling.
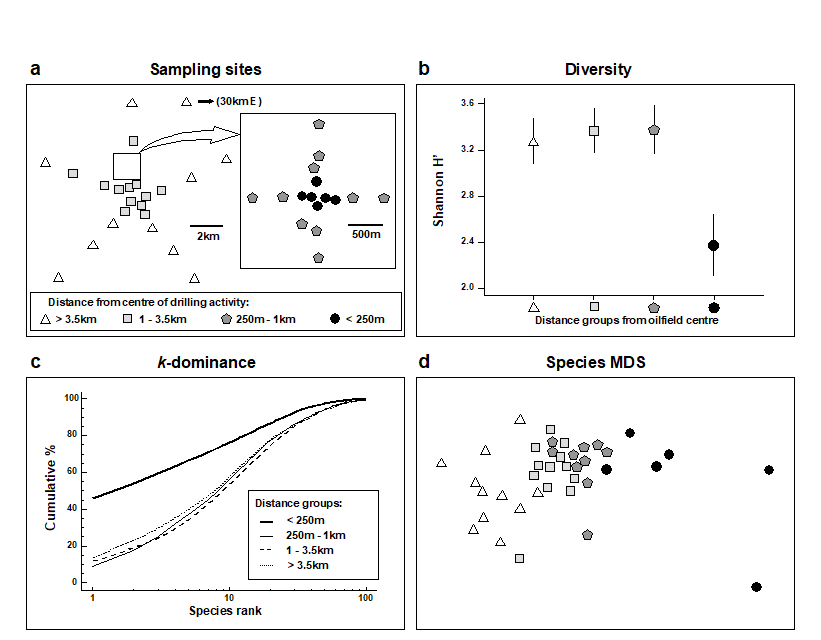
Fig. 14.4. Ekofisk macrobenthos {E}. a) Map of sampling sites, represented by different symbol and shading conventions according to their distance from the 2/4K rig at the centre of drilling activity; b) Shannon diversity (mean and 95% confidence intervals) in these distance zones; c) mean k-dominance curves; d) MDS from root-transformed species abundances (stress = 0.12).
Univariate indices
It can be seen from Fig. 14.4b that species diversity was only significantly reduced in the zone closer than 250m from the rig, and that the three outer zones did not differ from each other in terms of Shannon diversity (this conclusion extends to the other standard measures such as species richness and other evenness indices).
Graphical/distributional plots
The k-dominance curves (Fig. 14.4c) also only indicate a significant effect within the inner zone, the curves for the three outer zones being closely coincident.
Multivariate analysis
In the MDS analysis (Fig. 14.4d) community composition in all of the zones was distinct, and there was a clear gradation of change from the inner to outer zones. Formal significance testing (using ANOSIM) confirmed statistically the differences between all zones. It will be recalled from Chapter 10 that there was also a clear distinction between all zones at higher taxonomic levels than species (e.g. family), even at the phylum level for some zones.
Conclusions
Univariate and graphical methods of data analysis suggest that the effects on the benthic fauna are rather localised. The MDS is clearly more sensitive, and can detect differences in community structure up to 3 km away from the centre of activity.
Example 3: Reef corals at South Pari Island, Indonesia
Warwick, Clarke & Suharsono (1990)
analysed coral community responses to the El Niño of 1982-3 at two reef sites in the Thousand Islands, Indonesia {I}, based on 10 replicate line transects for each of the years 1981, 83, 84, 85, 87 and 88.
Univariate indices
At Pari Island there was an immediate reduction in diversity in 1983, apparent full recovery by 1985, with a subsequent but not significant reduction (Fig. 14.5).
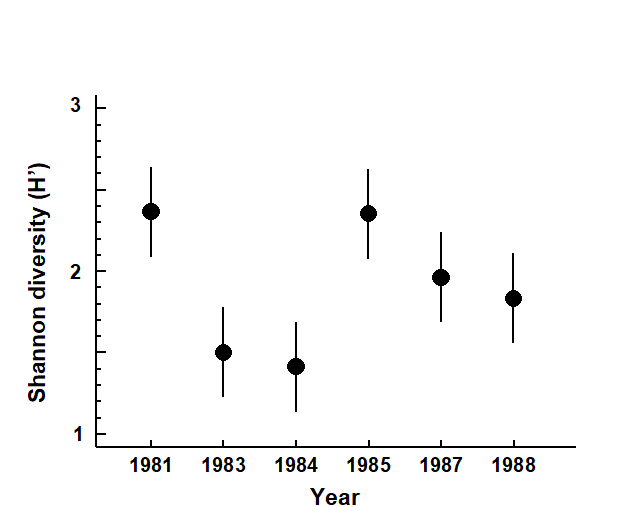
Fig. 14.5. Indonesian reef corals, Pari Island {I}. Shannon diversity (means and 95% confidence intervals) of the species coral cover from 10 transects in each year.
Graphical/distributional plots
The mean k-dominance curves were similar in 1981 and 1985, with the curves for 1983, 1984, 1987 and 1988 more elevated (Fig. 14.6). Tests on the replicate curves (using the DOMDIS routine given on page 8.5, followed by ANOSIM) confirmed the significance of differences between 1981, 1985 and the other years, but the latter were not distinguishable from each other.
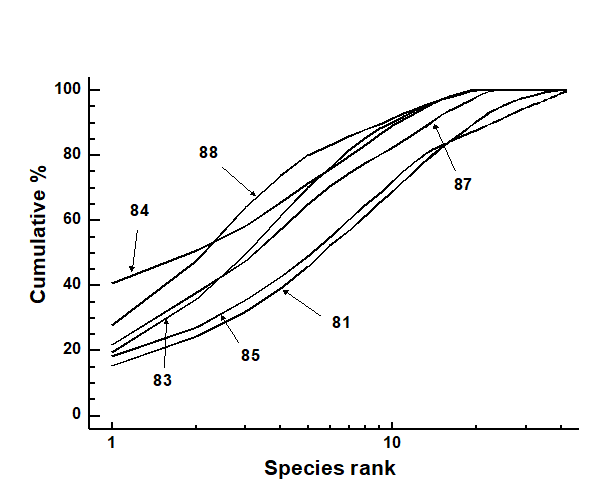
Fig. 14.6. Indonesian reef-corals, Pari Island {I}. k-dominance curves for totals of all ten replicates in each year.
Multivariate analysis
Though the MDS has rather a high stress it nonetheless shows an immediate location shift in community composition at the ten replicate sites between 1981 and 1983, and ANOSIM indicates significant differences between all pairs of years. Recovery proceeded in the pre-El Niño direction but was not complete by 1988 (Fig. 14.7).
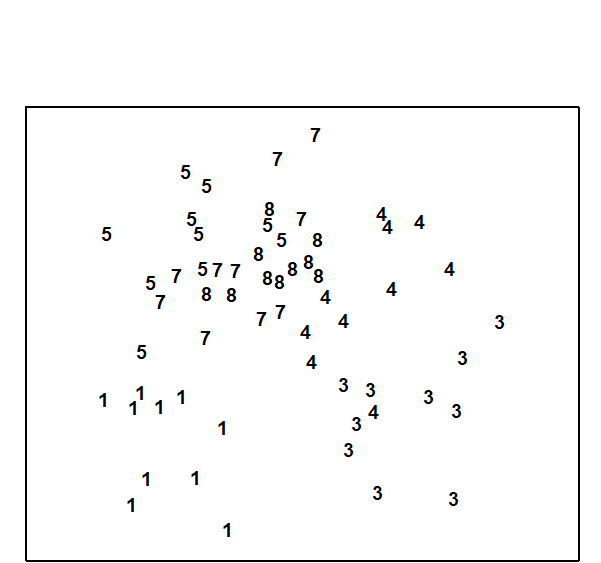
Fig. 14.7. Indonesian reef-corals, Pari Island {I}. MDS for coral species percentage cover data (1 = 1981, 3 = 1983 etc).
Conclusions
All methods of data analysis demonstrated the dramatic post El Niño decline in species, though the multivariate techniques were seen to be more sensitive in monitoring the recovery phase in later years.