17.8 Variation in taxonomic distinctness, $\Lambda ^ +$
VarTD was defined in equation (17.7), as the variance of the taxonomic distances {$\omega _ {ij}$} between each pair of species i and j, about their mean distance $\Delta ^ +$. It has the potential to distinguish differences in taxonomic structure resulting, for example, in assemblages with some genera becoming highly species-rich whilst a range of other higher taxa are represented by only one (or a very few) species. In that case, average TD may be unchanged but variation in TD will be greatly increased, and Clarke & Warwick (2001) argue (on a sample of one!) that this might be expected to be characteristic of island fauna, such as that for the Isles of Scilly.
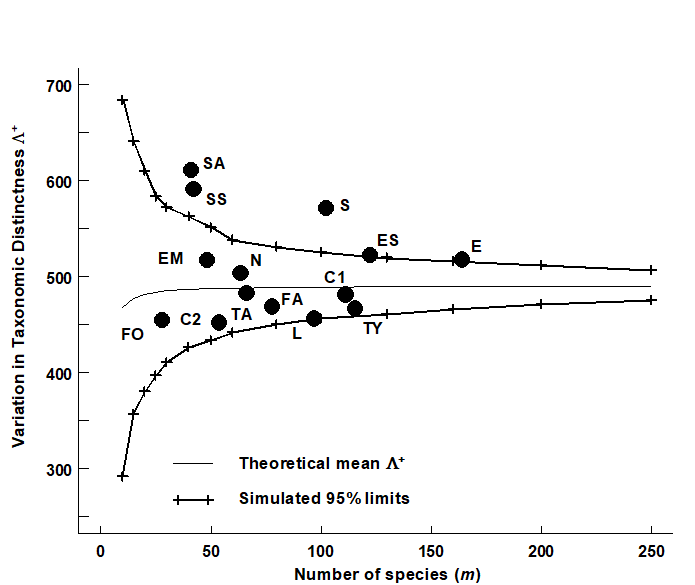
Fig. 17.14. UK regional study, free-living nematodes {U}. Funnel plot, as in Fig. 17.8, but for simulated VarTD ($\Lambda ^ +$), against sublist sizes m=10, 15, 20, …, 250 (x-axis), drawn from the 395-species master list. Thin line denotes the theoretical (and simulated) mean $\Lambda ^ +$, which is no longer entirely constant, declining very slightly for small values of m. The bias is clearly negligible, however, showing that (like $\Delta ^ +$) $\Lambda ^ +$ is comparable across studies with differing sampling effort (as here). Superimposed observed $\Lambda ^ +$ values for the 14 location/habitat combinations (Fig. 17.6) show a significantly larger than expected VarTD for the Scilly datasets.
For the UK nematode study {U}, Fig. 17.14 displays the funnel plot for VarTD ($\Lambda ^ +$) which is the companion to Fig. 17.8 (for AvTD, $\Delta ^ +$). It is constructed in the same way, by many random selections of sublists of a fixed size m from the UK master list of 395 nematode species, and recomputation of $\Lambda ^ +$ for each subset. The resulting histograms are typically more symmetric than for $\Delta ^ +$, as seen by the 95% probability limits for ‘expected’ $\Lambda ^ +$ values, across the full range of sublist sizes: m = 10, 15, 20, 25, …, shown in Fig. 17.14. Three features are noteworthy:
-
The simulated mean $\Lambda ^ +$ (thin line in Fig. 17.14) is again largely independent of sublist size, only declining slightly for very short lists (and the slight bias is dwarfed by the large uncertainty at these low sizes). Clarke & Warwick (2001) derive an exact formula for the sampling bias of $\Lambda ^ +$ and show, generally, that it will be negligible. This again has important practical implications because it allows $\Lambda ^ +$ to be meaningfully compared across (historic) studies in which sampling effort is uncontrolled.
-
The various UK habitat/location combinations all fall within ‘expected’ ranges, with the interesting exception of the Scilly data sets. These have significantly higher VarTD values, as discussed above.
-
$\Lambda ^ +$ therefore appears to be extracting independent information, separately interpretable from $\Delta ^ +$, about the taxonomic structure of individual data sets. This assertion is testable by a bivariate approach.