6.13 Example: Phuket coral-reef time series
These data are discussed more fully in Chapters 15 and 16; sampling of coral assemblages took place over a number of years between 1983 and 2000, see Brown, Clarke & Warwick (2002) , along three permanent transects. Transect A, considered here, was sampled on each occasion by twelve ‘10m plotless line samples’, perpendicular to the main transect and spaced at about 10m. Percentage cover of each line sample by each of 53 coral taxa was recorded, {K}.
For this example, we consider a sequence of 7 years of ‘normal’ conditions, i.e. all samples collected over 1988 to 1997 (later chapters examine earlier and later years subject to impacts of different types). This is therefore a two-factor unreplicated crossed design, with one spatial factor (position on transect) and one temporal factor (year), with the spatial factor clearly ordered and the temporal factor capable of being analysed either as unordered or ordered, depending on whether the test is for non-specific inter-annual variation or for a trend in time.
Fig. 6.14 shows the MDS of the beginning and ending years of this selected time period, for the 12 positions along the transect (inshore to offshore, 1 to 12), based on Bray-Curtis similarities from the root-transformed %cover data. The other 4 years have similarly clear spatial trends, so it is not surprising that the ordered ANOSIM test for Position (the B factor in case 2d of Table 6.3), which uses the unreplicated $\overline{R}^{Os}$ statistic, an average of the separate $R^{Os}$ statistics over 7 years, returns the high value of 0.68 (p < 0.1%, though significant at any specified level, in practice). In spite of the absence of replication, separate analyses of the position factor for each year are now possible, i.e. a 1-way ordered ANOSIM without replication (case 1d). E.g. the spatial trends seen in Fig. 6.14 for 1988 and 1997 have $R^{Os} = 0.65$ and 0.73 (both p < 0.1%).
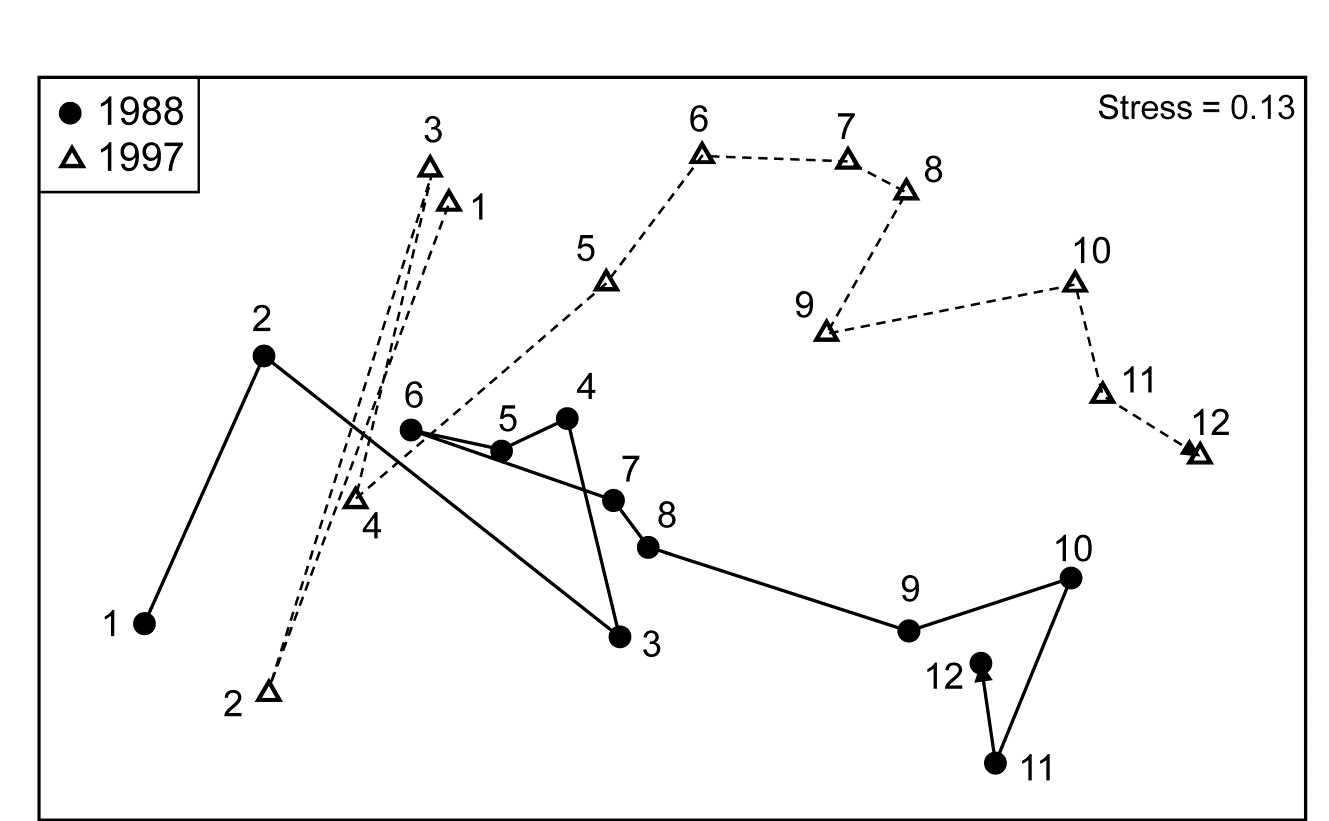
Fig. 6.14. Ko Phuket corals {K}. nMDS for two years from coral cover of 53 taxa (root-transform, Bray-Curtis similarities), at 12 positions along an inshore-offshore transect.
The general test for the Year factor (A in case 2d of Table 6.3), in contrast gives $\rho_{av} = 0.02$ (ns, no year effect). A more directed test of a trend over the seven years between the starting and ending configurations seen in Fig. 6.14 (case 2f), based on an average of the $R^{Os}$ statistics through the years, separately for each transect position, also gives a low and non-significant value for $\overline{R}^{Os}$ of 0.08 (p $\approx$ 10%). However, if earlier and later years are also included, which saw a sedimentation impact and a prolonged desiccation of the reefs, then a small trend is detected $\overline{R}^{Os} = 0.18$, p < 0.1%), though this is more clearly seen as an ‘interaction’ in the second-stage analysis in Chapter 16.