17.7 Example: N Europe groundfish surveys
An investigation of the taxonomic structure of demersal fish assemblages in the North Sea, English Channel and Irish Sea, motivated by concerns over the impacts of beam trawling, is reported by Rogers, Clarke & Reynolds (1999) . A total of 277 ICES quarter-rectangles were sampled for 93 species of groundfish {b}, by research vessels from different N European countries. Sampling effort per rectangle was not constant. For the purposes of display, quarter-rectangles were grouped into 9 larger sea-areas: 1–Bristol Channel, …, 9–Eastern Central N Sea (Fig. 17.10, see legend for area definitions).
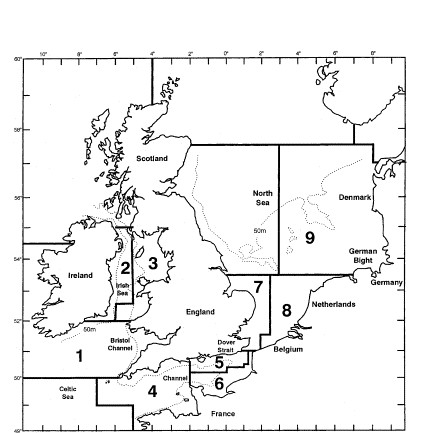
Fig. 17.10. Beam-trawl surveys, for groundfish, N Europe {b}. 277 rectangles from 9 sea areas. 1: Bristol Channel, 2: W Irish Sea, 3: E Irish Sea, 4: W Channel, 5: NE Channel, 6: SE Channel, 7: SW North Sea, 8: SE North Sea, 9: E Central North Sea.
There is a wealth of taxonomic detail to exploit in this case. The analysis uses a 14-level classification (Fig. 17.11), based on phylogenetic information, compiled by J.D. Reynolds (Univ E Anglia), primarily from Nelson (1994) and McEachran & Miyake (1990) . The distinctness structure of this master list, and its AvTD of $\Delta ^ + = 80.1$, for all groundfish species that could be reliably sampled and identified, becomes the standard against which the species lists from the various quarter-rectangles are assessed.
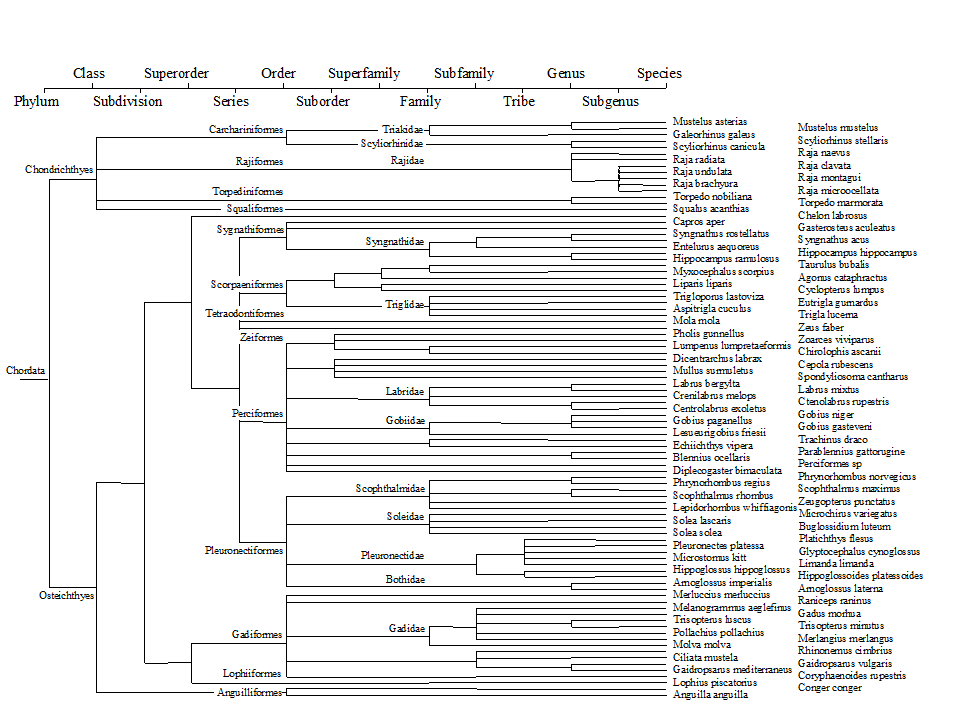
Fig. 17.11. Beam-trawl surveys, for groundfish, N Europe {b}. 14-level classification (phylogenetically-based) used for the construction of taxonomic distances between 93 demersal fish species, those that could be reliably sampled and identified for the 277 rectangles in this N European study.
Funnel plot
Fig. 17.12 displays the resulting funnel plot of the range of $\Delta ^ +$ values expected from sublists of size 5 to 35, repeating the mean, lower and upper limits in sub-plots of observed $\Delta ^ +$ values for the 9 sea areas. $\Delta ^ +$ is clearly seen to be reduced in some areas, particularly 6, 8 and 9, whilst remaining at ‘expected’ levels in others. Rogers, Clarke & Reynolds (1999) discuss possible explanations for this, noting the contribution made by the spatial pattern of elasmobranchs, a taxonomic group they argue may be particularly susceptible to disturbance by commercial trawling, because of their life history traits.
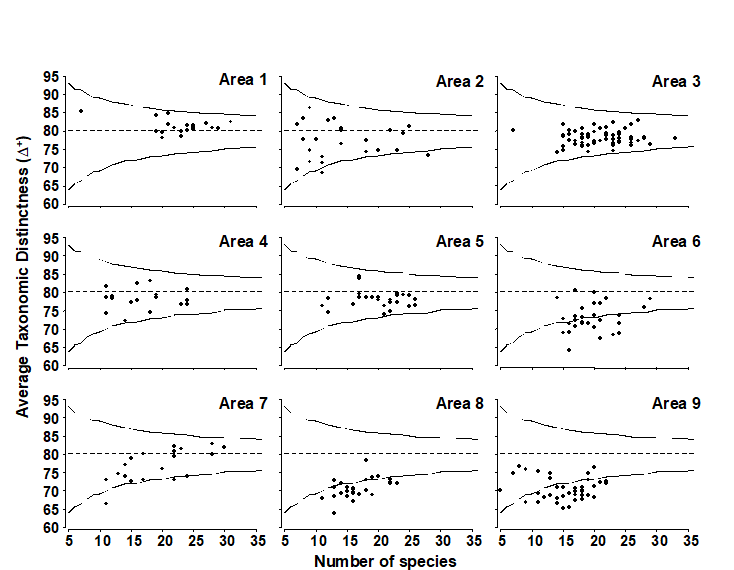
Fig. 17.12. Beam-trawl surveys, for groundfish, N Europe {b}. AvTD (presence/absence data) against observed number of species, in each of 274 rectangles, grouped into 9 sea areas (Fig. 17.10). Dashed line indicates mean of 5000 simulated sublists for each size m = 5, 6, 7, …, 35, confirming the theoretical unbiasedness and therefore comparability of $\Delta ^ +$ for widely differing degrees of sampling effort. Continuous lines denote 95% probability limits for $\Delta ^ +$ from a single sublist of specified size from the master list (of 93 species).
Weighting of step lengths
Many of the fine-scale phylogenetic groupings in Fig. 17.11 are utilised comparatively rarely (e.g. subgenera only within Raja, tribe only within the Pleuronectidae etc), and the standard assumption that all step lengths between taxonomic levels are given equal weight (7.69, in this case) may appear arbitrary. For example, if a new category is defined which is not actually used, then the resulting change in all the step lengths, in order to accommodate it, seems unwarranted. The natural alternative here is to make the step lengths proportional to the extent of group melding that takes place, larger steps corresponding to larger decreases in taxon richness. A null category would then add no additional step length. Table 17.1 shows the resulting taxonomic distances {$\omega ^ {(0)}$} between species connected at the differing levels, contrasted with the standard, equal-stepped, distances {$\omega$}. Obviously, both are standardised so that the largest distance in the tree (between species in the different classes Chondrichthyes and Osteichthyes) is set to 100.
Table 17.1. Beam-trawl surveys, for groundfish, N Europe {b}. The 13 taxonomic/phylogenetic categories (k) used in the groundfish study, the standard taxonomic distances {$\omega _ k$} and an alternative formulation {$\omega _ k ^ {(0)}$} based on taxon richness {sk} at each level. $\omega_k$ (or $\omega _ k ^ {(0)}$) is the path length between species from different taxon group k but the same group k+1.
 k k |
Taxon | sk | $\omega _ k$ | $\omega _ k ^ {(0)}$ |
|---|---|---|---|---|
| 1 | Species | 93 | 7.7 | 1.3 |
| 2 | Sub-genus | 89 | 15.4 | 6.9 |
| 3 | Genus | 72 | 23.1 | 8.9 |
| 4 | Tribe | 67 | 30.8 | 12.5 |
| 5 | Sub-family | 59 | 38.5 | 21.4 |
| 6 | Family | 41 | 46.2 | 22.9 |
| 7 | Super-family | 39 | 53.8 | 27.4 |
| 8 | Sub-order | 33 | 61.5 | 44.4 |
| 9 | Order | 14 | 69.2 | 54.9 |
| 10 | Series | 9 | 76.9 | 61.4 |
| 11 | Super-order | 7 | 84.6 | 65.6 |
| 12 | Sub-division | 6 | 92.3 | 85.3 |
| 13 | Class | 2 | 100.0 | 100.0 |
Fig. 17.13 demonstrates the minimal effect these revised weights have on the calculation of average taxonomic distinctness, $\Delta ^ +$ . It is a scatter plot of $\Delta ^ {+ (0)}$ (revised weights) against $\Delta ^ +$ (standard, equal-stepped, distances) for the 277 quarter-rectangle species lists. The relation is seen to be very tight, with only about 3 samples departing from near-linearity. (These are outliers of very low species richness – in one case as few as 2 species – and have been removed from Fig. 17.12.) Clearly, the relative values of $\Delta ^ +$ are robust in this case to the precise definition of the step-length weights, a reassuring conclusion which is also borne out for the UK nematode study {U}. For the data of Fig. 17.8, Clarke & Warwick (1999) consider the effects of various alternative step-length definitions, consistently increasing or decreasing the weights at higher taxonomic levels as well as weighting them by changes in taxon richness. The only alteration to the conclusions came from decreasing the step lengths at the higher (coarsest) taxonomic levels, especially suppressing the highest level altogether (so that species within different subclasses were considered no more taxonomically distant than those within different orders). The Scilly data sets then showed a clear change in their average distinctness in comparison with the other 11 $\Delta ^ +$ values.
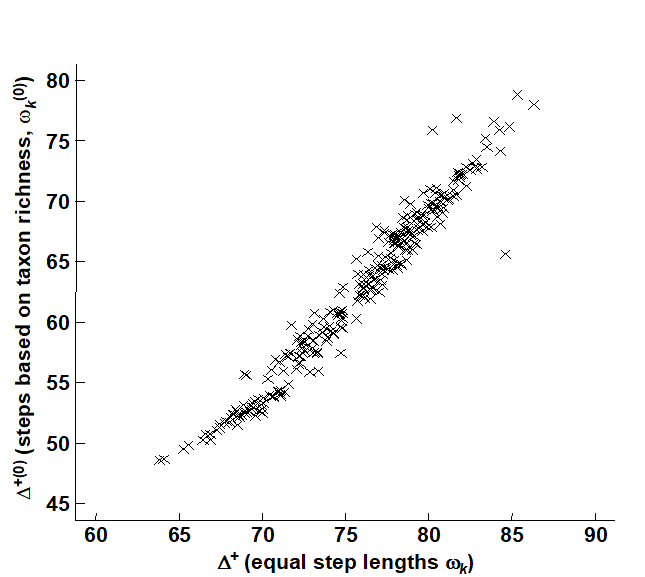
Fig. 17.13. Beam-trawl surveys, for groundfish, N Europe {g}. Comparison of observed $\Delta^+$, for each of 277 rectangles, between two weighting options for taxonomic distance between species: equal step-lengths between hierarchical levels (x-axis), and lengths proportional to change in taxonomic richness at that step (y-axis).
The unusual structure of the Scillies sublists is also exemplified, in a more elegant way, by considering not just average but variation in taxonomic distinctness.
¶ Both the PRIMER DIVERSE and TAXDTEST routines allow such compression of taxonomic levels, either at the top or bottom of the tree (or both), and also permit automatic computation of step-length weights based on changes in taxon richness and, indeed, any user-specified weighting.