12.4 Laboratory experiments
More or less natural communities of some components of the biota can be maintained in laboratory (and also outdoor) experimental containers and subjected to a variety of manipulations. Many types of experimental systems have been used for marine studies, ranging from microcosms (containers less than 1 m$^3$) to mesocosms (1–1000 m$^3$). Early examples of microcosm experiments analysed by multivariate means can be found, for example, in
Austen & McEvoy (1997)
,
Schratzberger & Warwick (1998b)
,
Schratzberger & Warwick (1999)
, and mesocosm experiments in
Austen, Widdicombe & Villano-Pitacco (1998)
,
Widdicombe & Austen (1998)
and
Widdicombe & Austen (2001)
. Macrocosms (larger than $10 ^ 3$ m$^ 3$), usually involving the artificial enclosure of natural areas in the field, have also been used, for pelagic studies, though replicating the treatment is often a significant problem.
Effects of organic enrichment on meiofaunal community structure {N}
Gee, Warwick, Schaanning et al. (1985)
collected undisturbed box cores of sublittoral sediment and transferred them to the experimental mesocosms established at Solbergstrand, Oslofjord, Norway. They produced organic enrichment by the addition of powdered Ascophyllum nodosum to the surface of the cores, in quantities equivalent to 50 g C m$^{-2}$ (four replicate boxes) and 200 g C m$^{-2}$ (four replicate boxes), with four undosed boxes as controls, in a randomised design within one of the large mesocosm basins. After 56 days, five small core samples of sediment were taken from each box and combined to give one sample. The structure of the meiofaunal communities in these samples was then compared.
Univariate indices. Table12.3 shows that, for the nematodes, there were no significant differences in species richness or Shannon diversity between treatments, but evenness was significantly higher in enriched boxes than controls. For the copepods, there were significant differences in species richness and evenness between treatments, but not in Shannon diversity.
Table 12.3. Nutrient-enrichment experiment {N}. Univariate measures for all replicates at the end of the experiment, with the F-ratio and significance levels from one-way ANOVA.
Species richness (d) |
Shannon diversity (H') |
Species evenness (J') |
|
|---|---|---|---|
| Nematodes | |||
| Control | 3.02 | 2.25 | 0.750 |
| 3.74 | 2.39 | 0.774 | |
| 3.36 | 2.47 | 0.824 | |
| 4.59 | 2.76 | 0.747 | |
| Low dose | 4.39 | 2.86 | 0.877 |
| 2.65 | 2.47 | 0.840 | |
| 4.67 | 2.89 | 0.875 | |
| 2.33 | 2.27 | 0.860 | |
| High dose | 2.86 | 2.17 | 0.782 |
| 2.82 | 2.39 | 0.843 | |
| 4.30 | 2.40 | 0.829 | |
| 4.09 | 2.47 | 0.853 | |
| F ratio | 0.04 | 1.39 | 5.13 |
| Sig level (p) | ns | ns | <5% |
| Copepods | |||
| Control | 2.53 | 1.93 | 0.927 |
| 1.92 | 1.56 | 0.969 | |
| 2.50 | 1.77 | 0.908 | |
| 2.47 | 1.94 | 0.931 | |
| Low dose | 1.80 | 1.60 | 0.643 |
| 1.66 | 1.28 | 0.532 | |
| 1.66 | 1.16 | 0.484 | |
| 1.79 | 1.54 | 0.640 | |
| High dose | 1.75 | 1.59 | 0.767 |
| 0.97 | 1.00 | 0.620 | |
| 1.03 | 0.30 | 0.165 | |
| 1.18 | 1.70 | 0.872 | |
| F ratio | 17.72 | 2.65 | 4.56 |
| Sig level (p) | <0.1% | ns | <5% |
Graphical/distributional plots. Fig. 12.5 shows the average k-dominance curves over all four boxes in each treatment. For the nematodes these are closely coincident, suggesting no obvious treatment effect. For the copepods, however, there are apparent differences between the curves. A notable feature of the copepod assemblages in the enriched boxes was the presence, in highly variable numbers, of several species of the large epibenthic harpacticoid Tisbe, which are ‘weed’ species often found in old aquaria and associated with organic enrichment. If this genus is omitted from the analysis, a clear sequence of increasing elevation of the k-dominance curves is evident from control to high dose boxes.

Fig. 12.5. Nutrient enrichment experiment {N}. k-dominance curves for nematodes, total copepods and copepods omitting the ‘weed’ species of Tisbe, for summed replicates of each treatment, C = control, L = low and H = high dose.
Table 12.4. Nutrient enrichment experiment {N}. Values of the R statistic from the ANOSIM test, in pairwise comparisons between treatments, together with significance levels. C = control, L = low dose, H = high dose.
| Treatment | Statistic value (R) |
% Sig. level |
|
|---|---|---|---|
| Nematodes | |||
| (L,C) | 0.27 | 2.9 | |
| (H,C) | 0.22 | 5.7 | |
| (H,L) | 0.28 | 8.6 | |
| Copepods | |||
| (L,C) | 1.00 | 2.9 | |
| (H,C) | 0.97 | 2.9 | |
| (H,L) | 0.59 | 2.9 |
Multivariate analysis. Fig. 12.6 shows that, in an MDS of $\sqrt{} \sqrt{}$-transformed species abundance data, there is no obvious discrimination between treatments for the nematodes. In the ANOSIM test (Table 12.4) the values of the R statistic in pairwise comparisons between treatments are low (0.2–0.3), but there is a significant difference between the low dose treatment and the control, at the 5% level. For the copepods, there is a clear separation of treatments on the MDS, the R statistic values are much higher (0.6–1.0), and there are significant differences in community structure between all treatments.
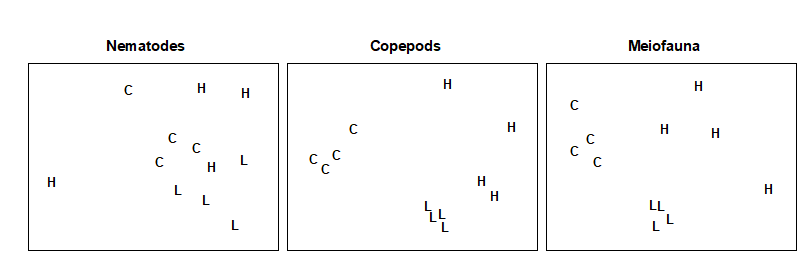
Fig. 12.6. Nutrient enrichment experiment {N}. MDS of $\sqrt{} \sqrt{}$-transformed abundances of nematodes, copepods and total meiofauna (nematodes + copepods). C = control, L = low dose, H = high dose (stress = 0.18, 0.09, 0.12).
Conclusions. The univariate and graphical/distributional techniques show lowered diversity with increasing dose for copepods, but no effect on nematodes. The multivariate techniques clearly discriminate between treatments for copepods, and still have some discriminating power for nematodes. Clearly the copepods have been much more strongly affected by the treatments in all these analyses, but changes in the nematode community may not have been detectable because of the great variability in abundance of nematodes in the high dose boxes. The responses observed in the mesocosm were similar to those sometimes observed in the field where organic enrichment occurs. For example, there was an increase in abundance of epibenthic copepods (particularly Tisbe spp.) resulting in a decrease in the nematode/copepod ratio. In this experiment, however, the causal link is closer to being established, though the possible constraints and artefacts inherent in any laboratory mesocosm study should always be borne in mind (see, for example, the discussion in Underwood & Peterson (1988) ).