5.6 Example: Amoco-Cadiz oil spill, Morlaix
Benthic macrofaunal abundances of 251 species were sampled by Dauvin (1984) at 21 times between April 1977 and February 1982 (approximately quarterly), at station ‘Pierre Noire’ in the Bay of Morlaix. Ten grab samples (1m²) of sediment were collected on each occasion and pooled, thus substantially reducing the contribution of local-scale spatial variability to the ensuing multivariate analysis, which should allow temporal patterns to be seen more clearly. The time-series spanned the period of the ‘Amoco-Cadiz’ oil tanker disaster of March 1978; the sampling site was some 40km from the initial tanker break-up but major coastal oil slicks reached the Bay of Morlaix, {A}.
The 2-d MDS from Bray-Curtis similarities computed on 4th-root transformed abundances is seen in Fig. 5.8a, and has succeeded in reducing the 251-d species data to a 2-d plot with only modest stress (=0.09). It neatly shows: a) the scale of the seasonal cycle prior to the oil-spill (times A to E); b) marked community change immediately following the spill (time F), and further changes over the next year or so (G-K); c) a move towards greater stability, with a suggestion that the community is returning towards the region of its initial state, though it has certainly not achieved that by the end of the 5-year period; and d) the re-establishment of the seasonal cycle in this latter phase (J-M, N-Q, R-U).
In fact, this is an astonishingly succinct and meaningful summary of the main pattern of change in a very speciose data set, and shows well the power of MDS ordinations to capture continuous change rather than groupings of samples, which is all that a dendrogram displays. The latter is seen in the differing symbols in Fig 5.8a, used for SIMPROF groups (Chapter 3) from agglomerative clustering (Fig. 5.8b): eight groups are identified and they do split samples before and after the spill, and also by season, between winter+spring and summer+autumn periods, even in the last two years overriding inter-annual differences. The exception to that is over the immediate post-spill year, in which seasonal differences are not apparent. All of this makes sense and demonstrates the power of ordination and clustering methods together (literally, for the rotatable Fig. 5.8c, another PRIMER7 option). On their own, however, in a case where a time course of change is expected, the supremacy of ordination over cluster analysis is clear (contrast Figs. 5.8 a and b). A simple dendrogram gives weak interpretation since it lacks ordering, i.e. has no way of associating clusters with a temporal or spatial gradient (though see the discussion on dendrograms in shade plots, Chapter 7).
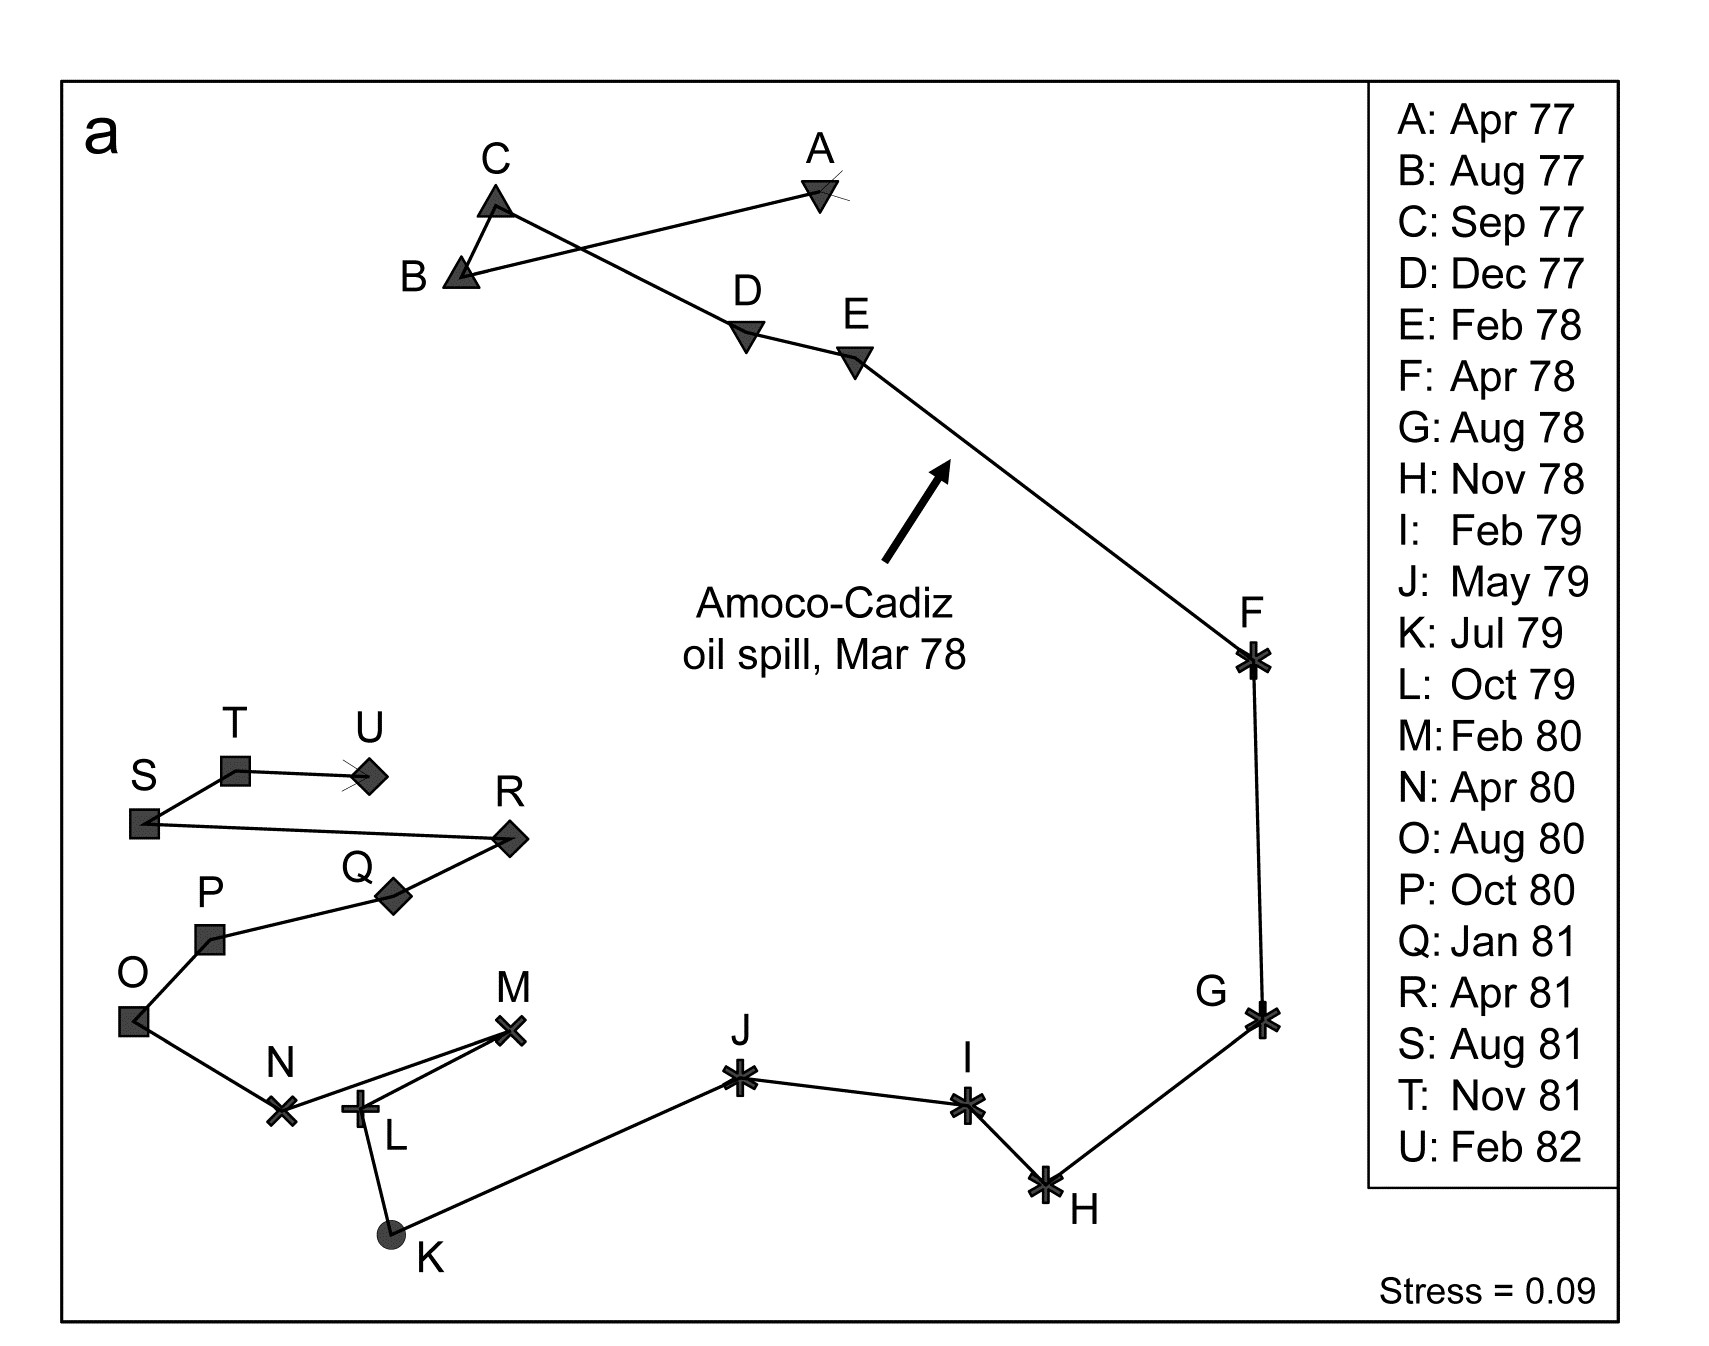
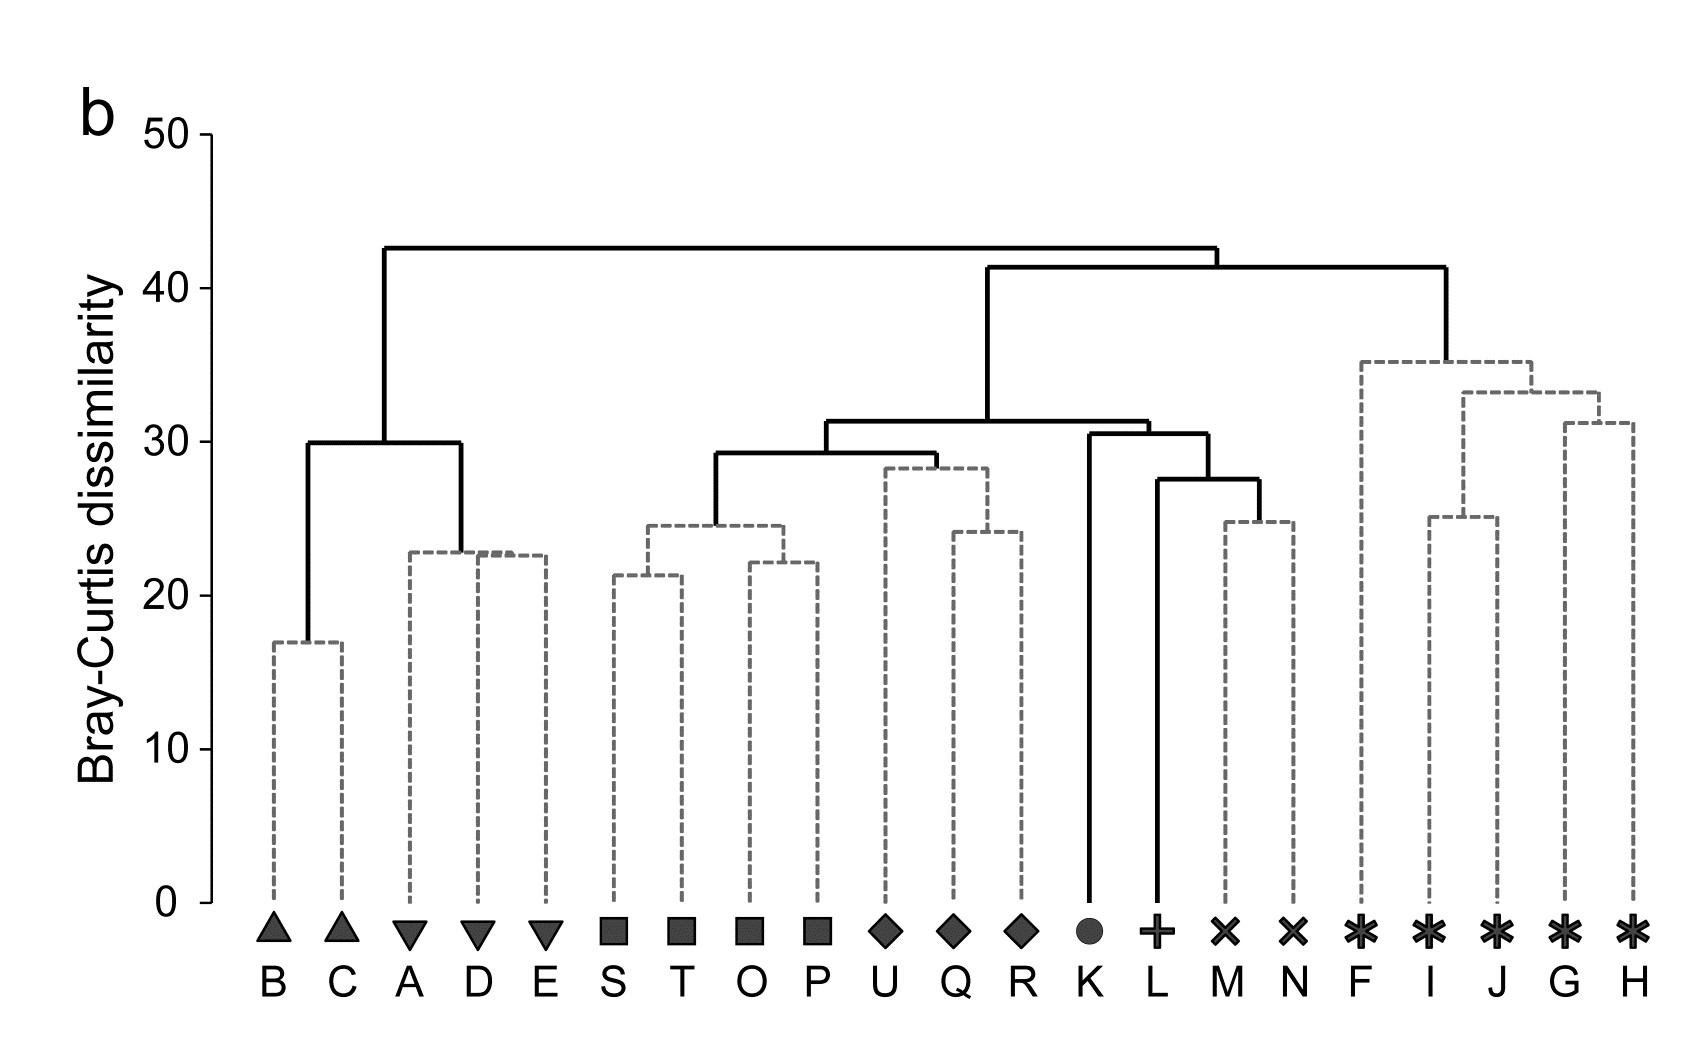
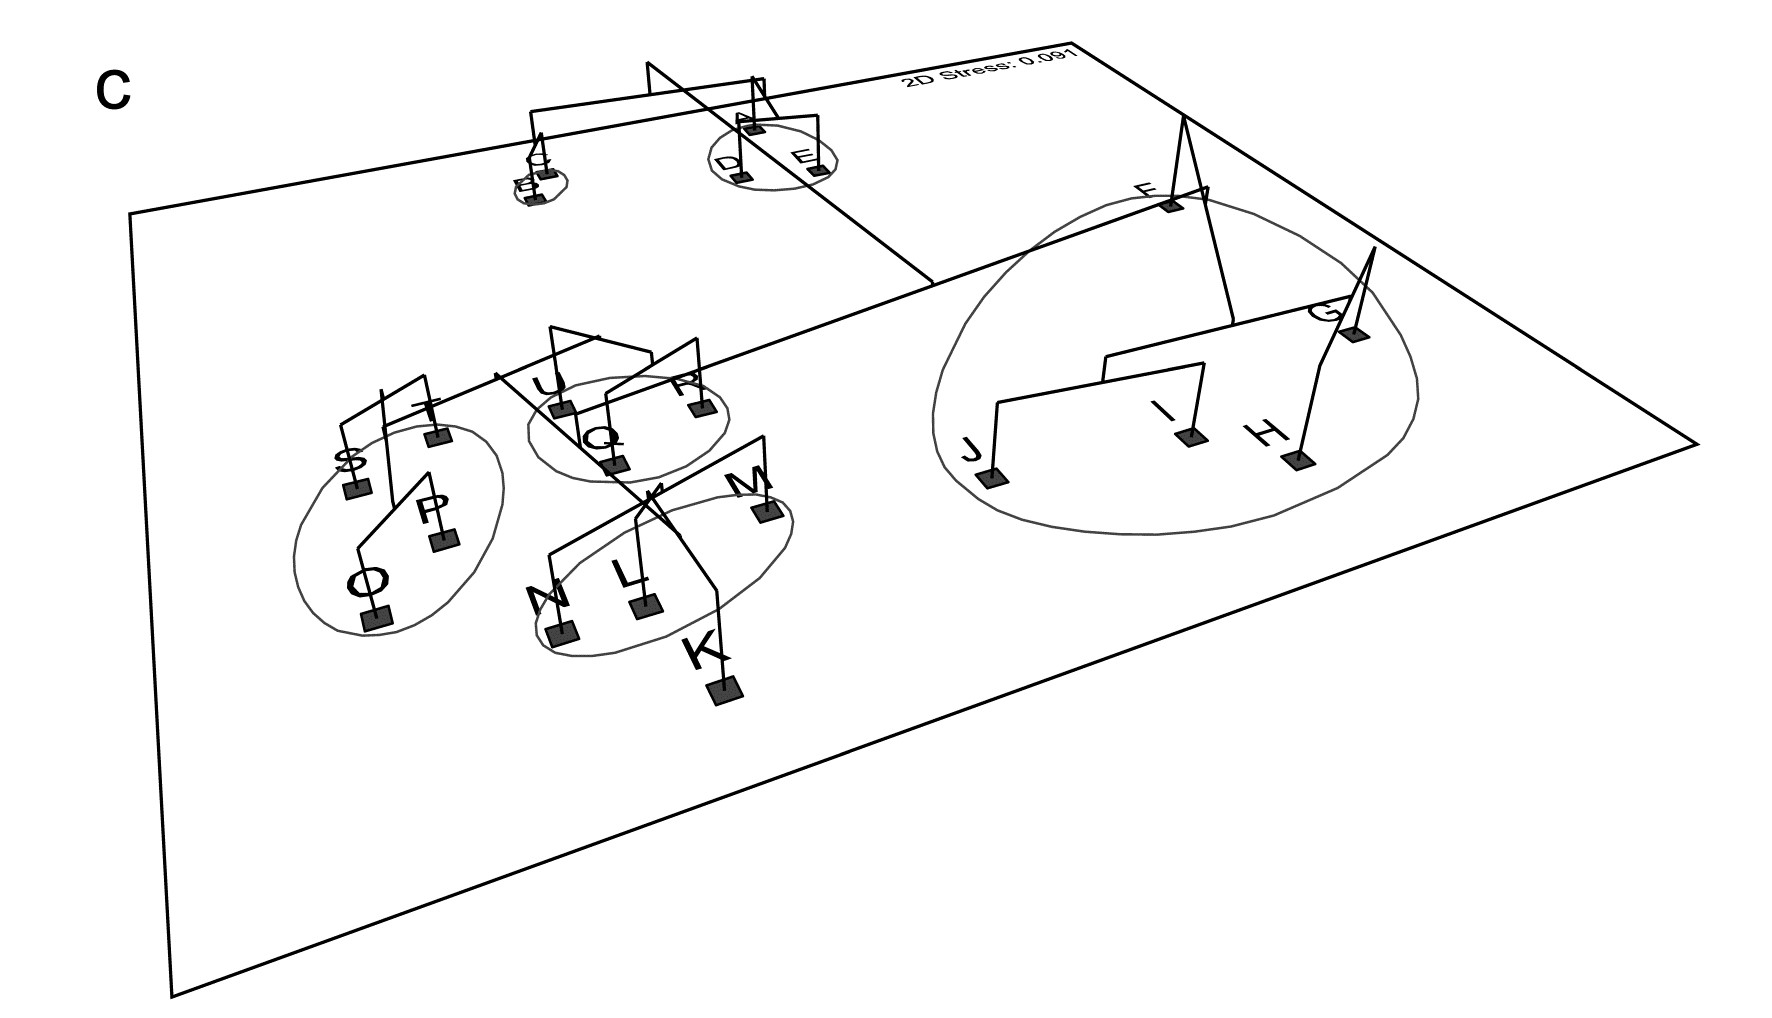
Fig. 5.8. Amoco-Cadiz oil spill {A}. Morlaix macrobenthos at 21 times (A to N). For Bray-Curtis on 4th-root transformed abundances: a) 2-d nMDS; b) agglomerative cluster analysis, both using symbols identifying the 8 groups given by SIMPROF tests; c) 2-d MDS as in (a) with SIMPROF groups identified and the dendrogram from (b) displayed in the 3rd dimension.