17.1 Species richness disadvantages
Chapter 8 discussed a range of diversity indices based on species richness and the species abundance distribution. Richness (S) is widely used as the preferred measure of biological diversity (biodiversity) but it has some major drawbacks, many of which apply equally to other diversity indices such as H$^\prime$, H, J$^\prime$, etc.
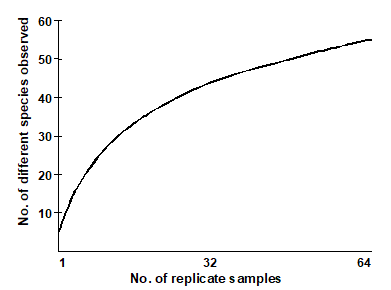
- Observed richness is heavily dependent on sample size/effort. In nearly all marine contexts, it is not possible to collect exhaustive census data. The assemblages are sampled using sediment cores, trawls etc, and the ‘true’ species richness of a station is rarely fully represented in such samples. For example, Gage & Coghill (1977) describe a set of contiguous core samples taken for macrobenthic species in a Scottish sea-loch. A species-area plot (or accumulation curve) which illustrates how the number of different species detected increases as the samples are accumulated¶, shows that, even after 64 replicate samples are taken at this single locality, the observed number of species is still rising.
“The harder you look, the more species you find” is fundamental to much biological sampling and the asymptote of accumulation curves is rarely reached. Observed species richness S is therefore highly sensitive to sample size and totally non-comparable across studies involving unknown, uncontrolled or simply differing degrees of sampling effort. The same is true, to a lesser extent, of many other standard diversity indices. Fig. 17.1 shows the effect of increasing numbers of individuals on the values of some of the diversity indices defined in Chapter 8. This is a sub-sampling study, selecting different numbers of individuals at random from a single, large community sample. The only index to demonstrate a lack of bias in mean value is Simpson diversity, given here in the form $1 - \lambda ^ \prime$, see equation (8.4). Comparison of richness, Shannon, evenness, Brillouin etc values for differing sample sizes is clearly problematic.
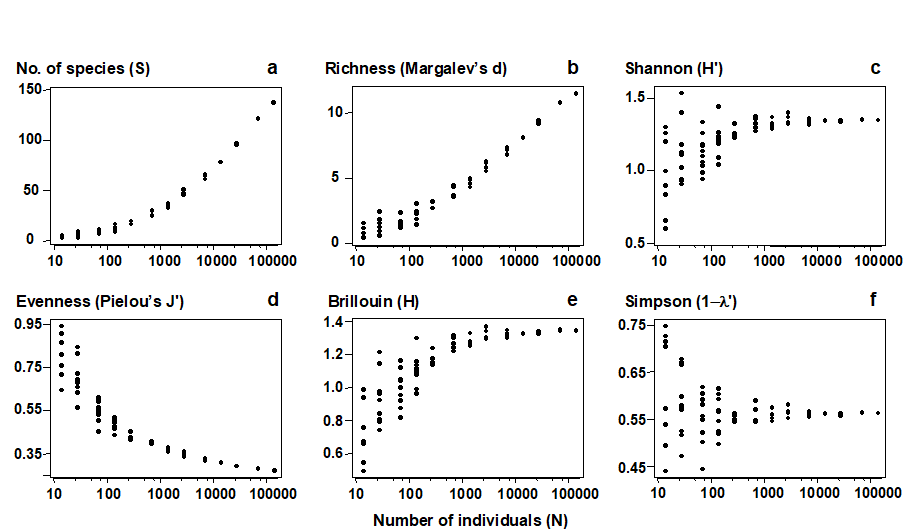
Fig. 17.1. Amoco-Cadiz oil spill {A}, pooled pre-impact data. Values of 6 standard diversity indices (y-axis, see Chapter 8 for definitions), for simulated samples of increasing numbers of individuals (x-axis, log scaled), drawn randomly without replacement from the full set of 140,344 macrobenthic organisms.
-
Species richness does not directly reflect phylogenetic diversity. “A measure of biodiversity of a site ought ideally to say something about how different the inhabitants are from each other” ( Harper & Hawksworth (1994) ). It is clear that a sample consisting of 10 species from the same genus should be seen as much less biodiverse than another sample of 10 species, all of which are from different families: genetic, phylogenetic or, at least, taxonomic relatedness of the individuals in a sample is the key concept which is developed in this chapter, into practical indices which genuinely reflect biodiversity and are robust to sampling effort variations.
-
No statistical framework exists for departure of S from ‘expectation’. Whilst observed species richness measures can be compared across sites (or times) which are subject to strictly controlled and equivalent sampling designs, there is no sense in which the values of S can be compared with some absolute standard, i.e. we cannot generally answer the question “what do we expect the richness to be at this site?”, in the absence of anthropogenic impact, say.
-
The response of S to environmental degradation is not monotonic. Chapter 8 discusses the well-established paradigm (see Wilkinson (1999) and references therein) that, under moderate levels of disturbance, species richness may actually increase, before decreasing again at higher impact levels. It would be preferable to work with a biological index whose relation to the degree of perturbation was purely monotonic (increasing or decreasing, but not both).
-
Richness can vary markedly with differing habitat type. Again, the ideal would be a measure which is less sensitive to differences in natural environmental variables but is responsive to anthropogenic disturbance.
¶ This uses the Species-Accumulation Plot routine in PRIMER, with the option of plotting the curve in the presented sample order or (as here) randomising that order a large number of times. In the latter case, the resulting curves are averaged to obtain a smooth relationship of average number of species for each number of replicates. The routine also computes several standard extrapolation models which attempt to predict the asymptotic number of species that would be found for an infinity of samples from the same (closed) location. Included are Chao estimators, jacknife and bootstrap techniques, see Colwell & Coddington (1994) .