17.6 Example: UK free-living nematodes
Warwick & Clarke (1998) examined 14 species lists from a range of different habitats and impacted/undisturbed UK areas ({U}, Fig. 17.6), referring them to a 6-level classification of free-living, marine nematodes ( Lorenzen (1994) ), based on cladistic principles. The taxonomic groupings were: species, genus, family, suborder, order and subclass, all within one class, thus giving equal step lengths between adjacent taxonomic levels of 16.67 (species within different subclasses then being at a taxonomic distance of $\omega = 100$). The relatively comprehensive British master list (updated from Platt & Warwick (1983) , Platt & Warwick (1988) , Warwick, Platt & Somerfield (1998) ) consisted of 395 species, the individual area/ habitat sublists ranging in size from 27 to 164 species. They included two studies of the same (generally impacted) area, the Firth of Clyde, carried out by different workers and resulting in very disparate sublist sizes (53 and 112).
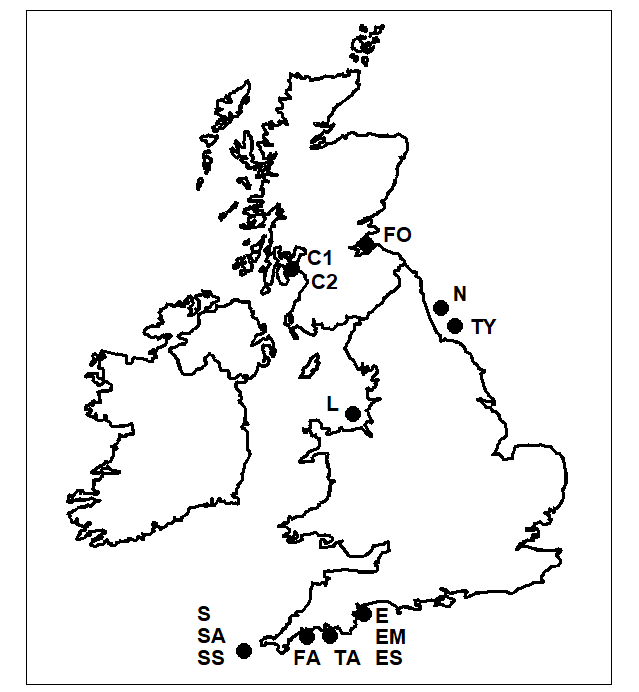
Fig. 17.6. UK regional study, free-living nematodes {U}. The location/habitat combinations for the 14 species sublists whose taxonomic distinctness structure is to be compared. Sublittoral offshore sediments at N: Northumberland (
Warwick & Buchanan (1970)
); TY: Tyne (
Somerfield, Gee & Widdicombe (1993)
); L: Liverpool Bay (
Somerfield, Rees & Warwick (1995)
. Intertidal sand beaches at ES: Exe (
Warwick (1971)
); C1: Clyde (
Lambshead (1986)
); C2: Clyde (
Jayasree (1976)
); FO: Forth (
Jayasree (1976)
); SS: Scilly (
Warwick & Coles (1977)
). Estuarine intertidal mudflats at EM: Exe (
Warwick (1971)
); TA: Tamar (
Austen & Warwick (1989)
); FA: Fal (
Somerfield, Gee & Warwick (1994a)
and
Somerfield, Gee & Warwick (1994b)
). Algal habitats in SA: Scilly (
Gee & Warwick (1994a)
and
Gee & Warwick (1994b)
). Also mixed habitats at E: Exe, S: Scilly.
Histograms
Species richness levels of the 14 lists are clearly not comparable since sampling effort is unequal. However, the studies have been rationalised to a common taxonomy and AvTD values may be meaningfully compared. Fig. 17.7 contrasts two of the studies, which have similar-length species lists: sandy sites in the Exe estuary (ES, 122 species) and the Firth of Clyde (C1, 112 species). Fig. 17.7a displays the histogram of $\Delta ^ +$ values for 999 random subsamples of size m = 122, drawn from the full inventory of 395 species, and this is seen to be centred around the master AvTD of 78.7, with a (characteristic) left-skewness to the $\Delta ^ +$ distribution. The observed $\Delta ^ +$ of 79.1 for the Exe data falls very close to this mean, in the body of the distribution, and therefore suggests no evidence of reduced taxonomic distinctness. Fig. 17.7b shows the histogram of simulated $\Delta ^ +$ values in subsets of size m = 112, having (of course) the same mean $\Delta ^ +$ of 78.7 but, in contrast, the observed $\Delta ^ +$ of 74.1 for the Clyde data now falls well below its value for any of the randomly selected subsets, demonstrating a significantly reduced average distinctness.
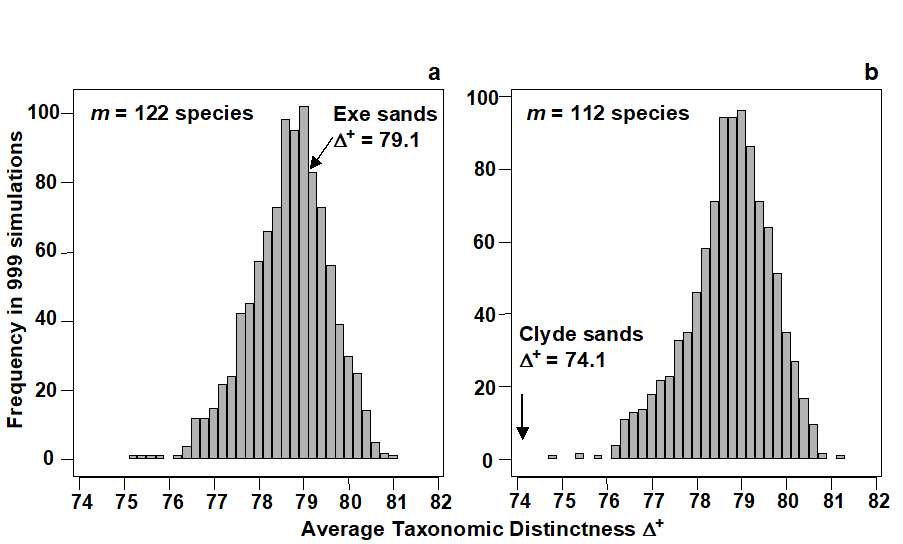
Fig. 17.7. UK regional study, free-living nematodes {U}. Histograms of simulated AvTD, from 999 sublists drawn randomly from a UK master list of 395 species. Sublist sizes of a) m=122, b) m=112, corresponding to the observed number of species in the Exe (ES) and Clyde (C1) surveys. True $\Delta ^ +$ also indicated: the Exe value is central but the null hypothesis that AvTD for the Clyde equates to that for the UK list as a whole is clearly rejected (p<0.001 or 0.1%)
Funnel plots

Fig. 17.8. UK regional study, free-living nematodes {U}. Funnel plot for simulated AvTD, as in Fig. 17.7, but for a range of sublist sizes m=10, 15, 20, …, 250 (x-axis). Crosses, and thick lines, indicate limits within which 95% of simulated $\Delta^+$ values lie; the thin line indicates mean $\Delta ^ +$ (the AvTD for the master list), which is not a function of m. Points are the true AvTD (y-axis) for the 14 location/habitat studies (see Fig. 17.6 for codes), plotted against their sublist size (x-axis).
Fig. 17.8 displays the funnel plot, catering for all sublist sizes. The simulated 95% probability limits are again based on 999 random selections for each of m = 10, 15, 20, …, 250 species from the 395. The mean $\Delta ^ +$ is constant for all m (at 78.7) but the limits become increasingly wide as the sample size decreases, reducing the likelihood of being able to detect a change in distinctness (i.e. reducing the power of the test). The probability limits also demonstrate the left-skewness of the $\Delta ^ +$ distribution about its mean throughout, though especially for low numbers of species. Superimposing the real $\Delta ^ +$ values for the 14 habitat/location combinations, five features are apparent:
-
The impacted areas of Clyde, Liverpool Bay, Fal and, to a lesser extent, Tamar, are all seen to have significantly reduced average distinctness, whereas pristine locations in the Exe and Scilly have $\Delta ^ +$ values close to that of the UK master list.
-
Unlike species richness (and in keeping with the ‘desirability criteria’ stated earlier), $\Delta^+$ does not appear to be strongly dependent on habitat type: Exe sand and mud habitats have very different numbers of species but rather centrally-placed distinctness; Scilly algal and sand habitats have near-identical $\Delta ^ +$ values. Warwick & Clarke (1998) also demonstrate a lack of habitat dependence in $\Delta ^ +$ from a survey of Chilean nematodes (data of W Wieser).
-
There is apparent monotonicity of response of the index to environmental degradation (also in keeping with another initial criterion). To date, there is no evidence of average taxonomic distinctness increasing in response to stress.
-
In spite of the widely differing lengths of their species lists, it is notable that the two Clyde studies (C1, C2) return rather similar (depressed) values for $\Delta ^ +$.
-
There is no evidence of any empirical relation in the ($\Delta ^ +$, S) scatter plot. We know from the sampling theory that the mechanics of calculating $\Delta ^ +$ does not lead to an intrinsic relationship between the two but that does not prevent there being an observed correlation; the latter would imply some genuine assemblage structuring which predisposed large communities to be more (or less) ‘averagely distinct’ than small communities. The lack of an intrinsic, mechanistic correlation greatly aids the search for such interesting observational relationships (see also the later discussion on AvTD, VarTD correlations). The same cannot be said for phylogenetic diversity, PD. Fig. 17.9a shows the expected near-linear relation between total PD and S for these meiofaunal studies (total TD and S would have given a similar picture) but, more significantly, Fig. 17.9b bears out the previous statements about the dependence also of average PD ($\Phi ^ +$) on S. This intrinsic relationship, shown by the declining curve for the expected value of $\Phi^+$ as a function of the number of species in the list, contrasts markedly with the constant mean line for $\Delta ^ +$ in Fig. 17.8. Nothing can therefore by read into an observed negative correlation of $\Phi ^ +$ and S in a practical study: such a relationship would be likely, as here, to be purely mechanistic, i.e. artefactual.
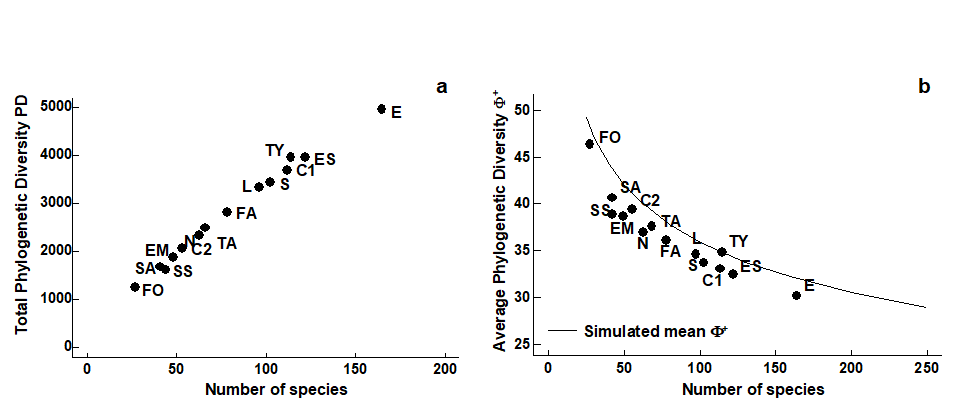
Fig. 17.9. UK regional study, free-living nematodes {U}. Scatter plots for the 14 location/habitat studies (Fig. 17.6) of: a) total PD, b) AvPD against list size m, the latter also showing the declining ‘expected’ mean $\Phi ^ +$ with m, simulated from sublists of the UK master list.
AvTD is therefore seen to possess many of the features listed at the beginning of the chapter as desirable in a biodiversity index – a function, in part, of its attractive mathematical sampling properties (for formal statistical results on unbiasedness and variance structure see Clarke & Warwick (1998b) and Clarke & Warwick (2001) ). Many questions remain, however – from theoretical issues of its dependence (or lack of it) on essentially arbitrary assumptions about relative weighting of step lengths through the taxonomic tree, to further practical demonstration of its performance (or lack of it) for other faunal groups and environmental impacts. The following example addresses these two questions in particular.