5.5 Example: Celtic Sea zooplankton
In situations where the samples are strongly grouped, as in Figs. 5.4 and 5.5, both clustering and ordination analyses will demonstrate this, usually in equally adequate fashion. The strength of ordination is in displaying a gradation of community composition over a set of samples. An example is provided by Fig. 5.7, of zooplankton data from the Celtic Sea {C}. Samples were collected from 14 depths, separately for day and night time studies at a single site. The changing community composition with depth can be traced on the resulting MDS plot (from Bray-Curtis similarities). There is a greater degree of variability in community structure of the near-surface samples, with a marked change in composition at about 20-25m; deeper than this the changes are steady but less pronounced and they step in parallel for day and night time samples.¶ Another obvious feature is the strong difference in community composition between day and night near-surface samples, contrasted with their relatively higher similarity at greater depth. Cluster analysis of the same data would clearly not permit the accuracy and subtlety of interpretation that is possible from ordination of such a gradually changing community pattern.
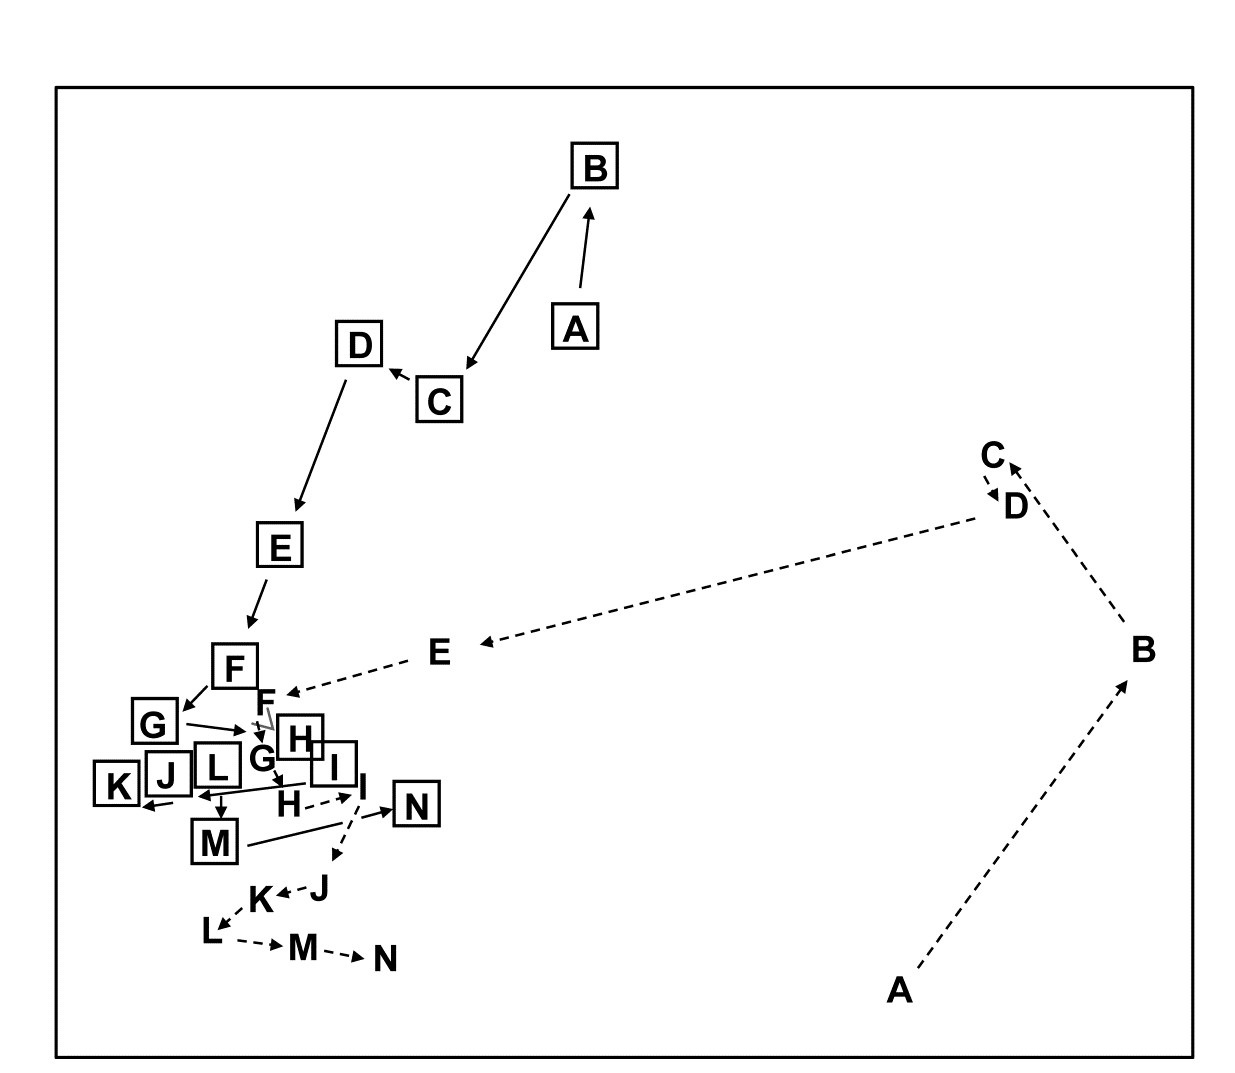
Fig. 5.7. Celtic Sea zooplankton {C}. MDS plot for night (boxed) and day time samples (dashed lines) from 14 depths (5 to 70m, denoted A,B,...,N), taken at a single site during September 1978.
Common examples of the same point can be found for time series data, where the construction of a time trajectory by connecting points on an ordination (sometimes, as above, with multiple trajectories on the same plot, e.g. contrasting time sequences at reference and impacted conditions) can be a powerful tool in the interpretational armoury from multivariate analysis, and another example of this point follows
¶ The precise relationships between the day and night samples for the larger depths (F-N) would now best be examined by an MDS of that data alone, the greater precision resulting from the MDS then not needing to cater, in the same 2-d picture, for the relationships to (and between) the A-E samples. This re-analysis of subsets should be a commonly-used strategy in the constant battle to display high-dimensional information in low dimensions.