6.11 Example: Ekofisk oil-field macrofauna
Gray, Clarke, Warwick et al. (1990) studied the soft-sediment macrobenthos at 39 sites at different distances (100m to 8km) and different directions away from the Ekofisk oil platform in the N Sea {E}, to examine evidence for changes in the assemblage with distance from the oil-rig. The sites were allocated (somewhat arbitrarily, but a priori) into 4 distance groups, A: >3.5km from the rig (11 sites), B: 1-3.5km (12), C: 250m-1km (10), D: <250m (6). An ordered 1-way ANOSIM test, with sites used as replicates for the four distance groups, does seem preferable here to the standard (unordered) ANOSIM. Though the null hypothesis $H_0: A=B=C=D$ is the same, the ordered alternative $H_1: A<B<C<D$ is an appropriate model for directed community change with distance. That is, there is no need for the test to have power to detect an (uninterpretable) alternative in which, for example, the communities in D are very different from C and B but then very similar to A, so by restricting the alternative to a smaller set of possibilities, we choose to employ a more powerful¶ test statistic $R^O$ for detecting that alternative, and for appropriately measuring its magnitude.
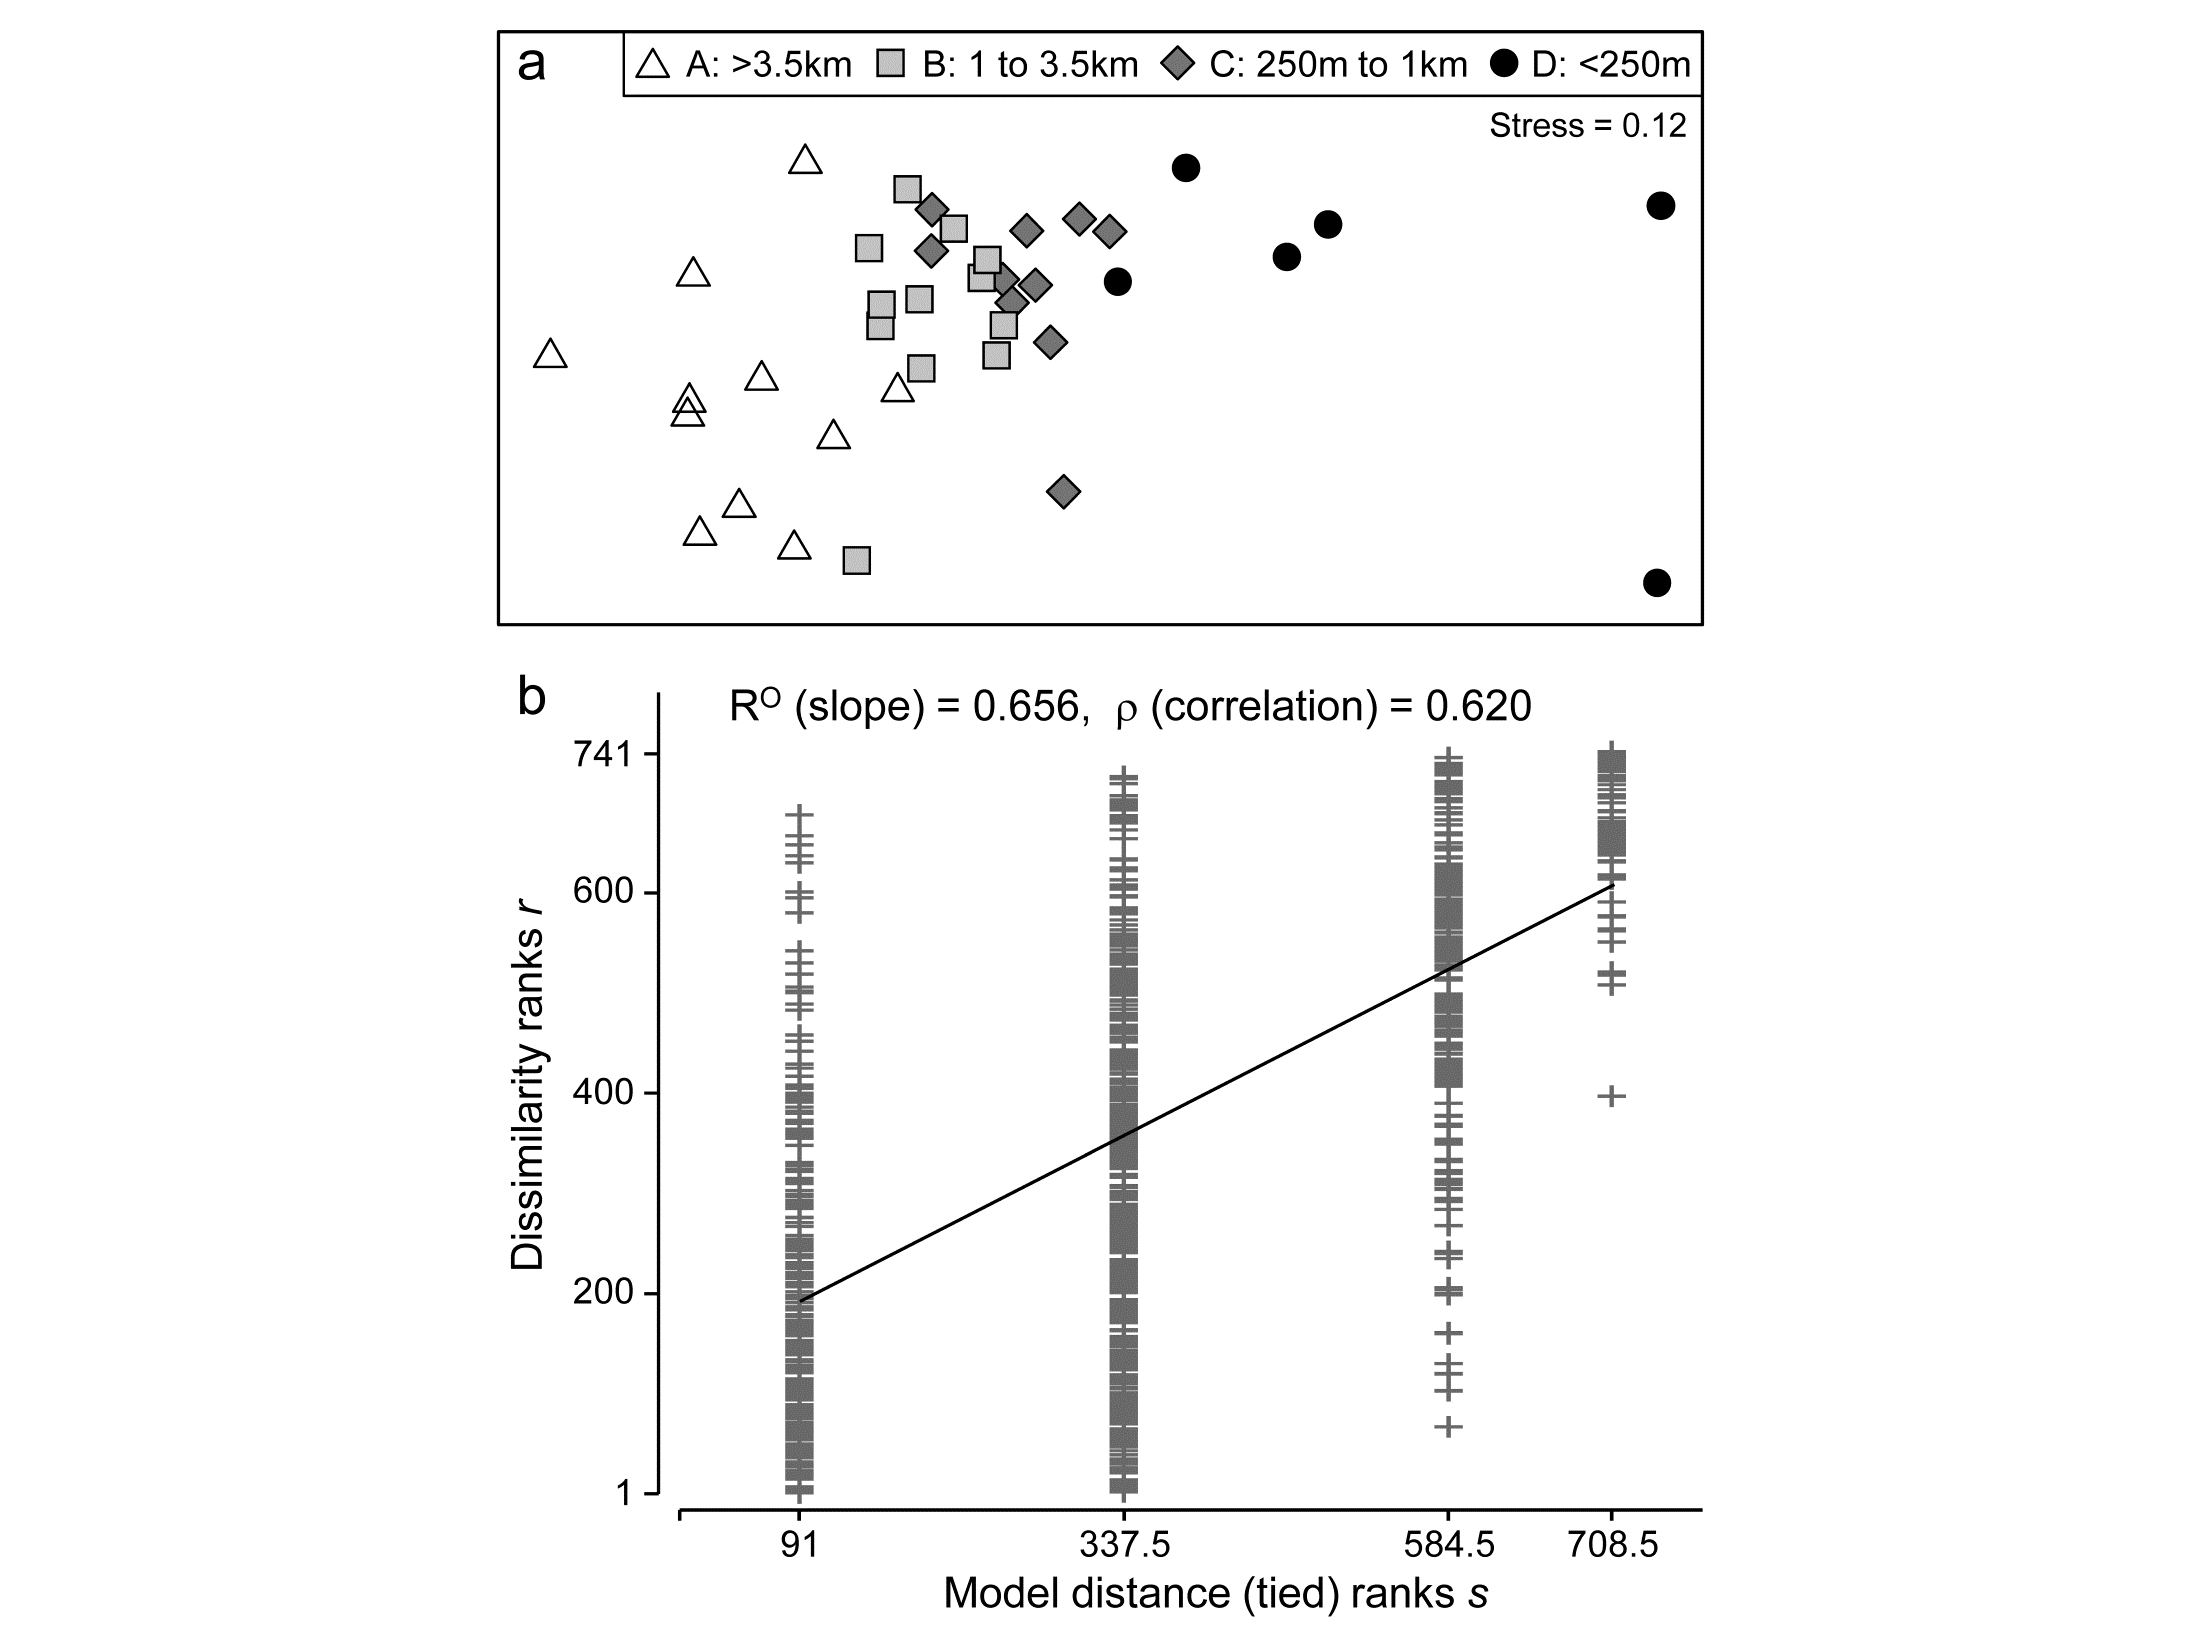
Fig 6.13a shows the (n)MDS for the 39 sites based on square-root transformed abundances of 173 species, under Bray-Curtis dissimilarity, with the 4 distance groups (differing symbols) clearly showing a pattern of steady community change with distance from the oil-rig. Fig 6.13b plots† the $39 \times 38/2 = 741$ rank dissimilarities {$r_i$} against the (ordered) model ranks {$s_i$}, the four sets of tied ranks for the latter representing (left to right): within A, B, C or D; then A to B, B to C or C to D; then A to C or B to D; and finally A to D. The fitted regression of r on s has a strong slope of $R^O = 0.656$, the ordered ANOSIM statistic, and this is larger than its value for 9999 random permutations of the group labels to the 39 samples, so P<0.01% at least (and it would clearly be more significant than effectively any proposed significance boundary here). The contrast is with a standard (unordered) ANOSIM test which records the lower (though still highly significant) value of R = 0.54. Clearly, if there are only two groups, $R^O$ and R become the same statistic, so the pairwise tests between all pairs of groups which follows this (global) ordered ANOSIM test are all exactly the same as for the usual unordered analysis.
 Fig. 6.13. Ekofisk oil-field macrofauna {E}. a) nMDS of the 39 sites from square-root transformed abundances of 173 species and Bray-Curtis similarities, with the four distance groups from the oil-rig indicated by differing symbols. b) Scatter plot of rank dissimilarities (r) among the 39 sites against tied ranks (s) from a serial ordering model of groups, showing the fitted regression line with slope $R^O$, the ordered ANOSIM statistic.
For the four Ekofisk distance groups, the pairwise R values do show the pattern expected from a gradient of change: for groups one step apart (A to B, B to C, C to D), R = 0.56, 0.16, 0.55; for two steps (A to C, B to D), R = 0.76, 0.82; and for three steps (A to D), R = 0.93 (all ‘significant’ by conventional criteria).
Fig. 6.13b clearly demonstrates how the (global) $R^O$ captures both the standard ANOSIM R’s contrast of within and between group ranks (the left-hand set of points vs the right-hand three sets) and the regression relation of greater change with greater distance (the right-hand three). It is thus useful in what follows to distinguish two cases for the ordered 1-way ANOSIM test, namely ordered category and ordered single statistics, denoted by $R^{Oc}$ and $R^{Os}$. The difference is simply that the notation $R^{Oc}$ is used when the data has replicates, so that it gives both a test for the presence of group structure and the ordering of those groups, whereas $R^{Os}$ refers to 1-way layouts with no replicates and where the test is thus entirely based on whether or not there is a serial ordering (trend) in the multivariate pattern of the ‘groups’ (i.e. single samples in this case), in the specified order. Technically, the computation is no different: both are simply the slope of the regression of the ranks {$r_i$} on {$s_i$}, though clearly the unreplicated design requires a reasonable number of ‘groups’ (at least 5, in the 1-way case) to generate sufficient permutations to have any prospect of demonstrating serial change.
¶ Somerfield, Clarke & Olsgard (2002) discuss the difficult issue of power in the context of multivariate analyses (for which a myriad of simple hypotheses make up the complex alternative to ‘no change’, since every species may respond in a different way to potential changes in its environment). They use the Spearman $\rho$ statistic throughout and demonstrate improved power for the alternative ‘seriation with replication’ model over the unordered case.
† Construction of such scatter plots (though not the regression line) can be achieved by a combination of routines on the Tools menu for PRIMER7, i.e. the Ranked resemblance matrix and Ranked triangular matrix created by the Model Matrix option under Seriation are Unravelled and then Merged, to give (x, y) columns for the Scatter Plot. The test itself uses the PRIMER7 extended ANOSIM routine.
