6.2 ANOSIM for the one-way layout
Fig.6.3 displays the MDS based only on the 12 samples (4 replicates per site) from the B, C and D sites of the Frierfjord macrofauna data. The null hypothesis (H$_o$) is that there are no differences in community composition at these 3 sites. In order to examine H$_o$, there are 3 main steps:
-
Compute a test statistic reflecting the observed differences between sites, contrasted with differences among replicates within sites. Using the MDS plot of Fig. 6.3, a natural choice might be to calculate the average distance between every pair of replicates within a site, and contrast this with the average distance apart of all pairs of samples corresponding to replicates from different sites. A test could certainly be constructed from these distances but it would have a number of drawbacks.
a) Such a statistic could only apply to a situation in which the method of display was an MDS rather than, say, a cluster analysis.
b) The result would depend on whether the MDS was constructed in two, three or higher dimensions. There is often no ‘correct’ dimensionality and one may end up viewing the picture in several different dimensions – it would be unsatisfactory to generate different test statistics in this way.
c) The configuration of B, C and D replicates in Fig. 6.3 also differs slightly from that in Fig. 6.2a, which includes the full set of sites A-E, G. It is again undesirable that a test statistic for comparing only B, C and D should depend on which other sites are included in the picture.
These three difficulties disappear if the test is based not on distances between samples in an MDS but on the corresponding rank similarities between samples in the underlying triangular similarity matrix. If $\overline{r}_W$ is defined as the average of all rank similarities among replicates within sites, and $\overline{r}_B$ is the average of rank similarities arising from all pairs of replicates between different sites¶, then a suitable test statistic is $$ R = \frac{ \left( \overline{r}_B - \overline{r}_W \right) }{ \frac{1}{2} M} \tag{6.1} $$ where M = n(n–1)/2 and n is the total number of samples under consideration. Note that the highest similarity corresponds to a rank of 1 (the lowest value), following the usual mathematical convention for assigning ranks.
The denominator constant in equation (6.1) has been chosen so that:
a) R can never technically lie outside the range (-1,1);
b) R = 1 only if all replicates within sites are more similar to each other than any replicates from different sites;
c) R is approximately zero if the null hypothesis is true, so that similarities between (among¶) and within sites will be the same on average.
R will usually fall between 0 and 1, indicating some degree of discrimination between the sites. R substantially less than zero is unlikely since it would correspond to similarities across different sites being higher than those within sites; such an occurrence is more likely to indicate an incorrect labelling of samples.† The R statistic itself is a very useful comparative measure of the degree of separation of sites§, and its value is at least as important as its statistical significance, and arguably more so. As with standard univariate tests, it is perfectly possible for R to be significantly different from zero yet inconsequentially small, if there are many replicates at each site.
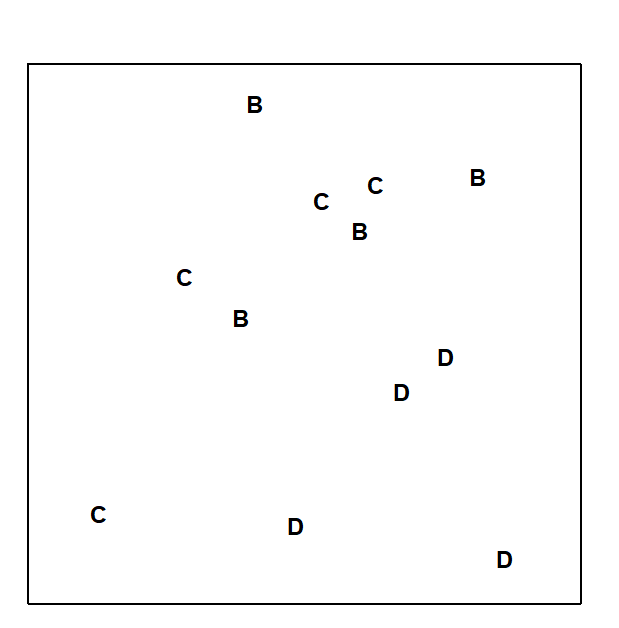
Fig. 6.3. Frierfjord macrofauna {F}. MDS ordination as for Fig. 6.2 but computed only from the similarities involving sites B, C and D (stress = 0.11).
-
Recompute the statistic under permutations of the sample labels. Under the null hypothesis H$ _ o$: ‘no difference between sites’, there will be little effect on average to the value of R if the labels identifying which replicates belong to which sites are arbitrarily rearranged; the 12 samples of Fig. 6.3 are just replicates from a single site if H$ _ o$ is true. This is the rationale for a permutation test of H$ _ o$; all possible allocations of four B, four C and four D labels to the 12 samples are examined and the R statistic recalculated for each. In general there are
$$ \left( kn \right) ! / \left[ \left( n! \right)^k k! \right] \tag{6.2}$$
distinct ways of permuting the labels for n replicates at each of k sites, giving 5775 permutations here. It is computationally possible to examine this number of re-labellings but the scale of calculation can quickly get out of hand with modest increases in replication, so the full set of permutations is randomly sampled (usually with replacement) to give the null distribution of R. In other words, the labels in Fig. 6.3 are randomly reshuffled, R recalculated and the process repeated a large number of times (T).
- Calculate the significance level by referring the observed value of R to its permutation distribution. If H$ _ o$ is true, the likely spread of values of R is given by the random rearrangements, so that if the true value of R looks unlikely to have come from this distribution there is evidence to reject the null hypothesis. Formally (as seen for the earlier SIMPROF test), if only t of the T simulated values of R are as large (or larger than) the observed R then H$_o$ can be rejected at a significance level of (t+1)/(T+1), or in percentage terms, 100(t+1)/(T+1)%.
¶ There is an interesting semantic difference here between US and British English, which has occasionally caused confusion in the literature! Here ‘between groups’ can imply between several groups and not just two (see Fowler’s Modern English Usage) whereas US usage always prefers ‘among groups’ in that context.
† Chapman & Underwood (1999) point out some situations in which negative R values (though not necessarily significantly negative) do occur in practice, when the community is species- poor and individuals have a heavily clustered spatial distribution, so that variability within a group is extreme. It usually also requires a design failure, e.g. a major stratifying factor (a differing substrate, say) is encompassed within each group but its effect is ignored in the analysis.
§ As was seen when assessing relative magnitude of competing group divisions in divisive cluster analysis, in Chapter 3.