17.3 Examples: Ekofisk oil-field and Tees Bay soft-sediment macrobenthos
The earlier Fig. 14.4 demonstrated a change in the sediment macrofaunal communities around the Ekofisk oil-field {E}, out to a distance of about 3 km from the centre of drilling activity. This was only evident, however, from the multivariate (MDS and ANOSIM) analyses, not from univariate diversity measures such as Shannon H$^ \prime$, where reduced diversity was only apparent up to a few hundred metres from the centre (Fig. 17.3a). The implication is that the observed community change resulted in no overall loss of diversity but this is not the conclusion that would have been drawn from calculating the quantitative average taxonomic distinctness index, $\Delta ^ \ast$. Fig. 17.3b shows a clear linear trend of increase in $\Delta ^ \ast$ with (log) distance from the centre, the relationship only breaking down into a highly variable response for the strongly impacted sites, within 100m of the drilling activity.
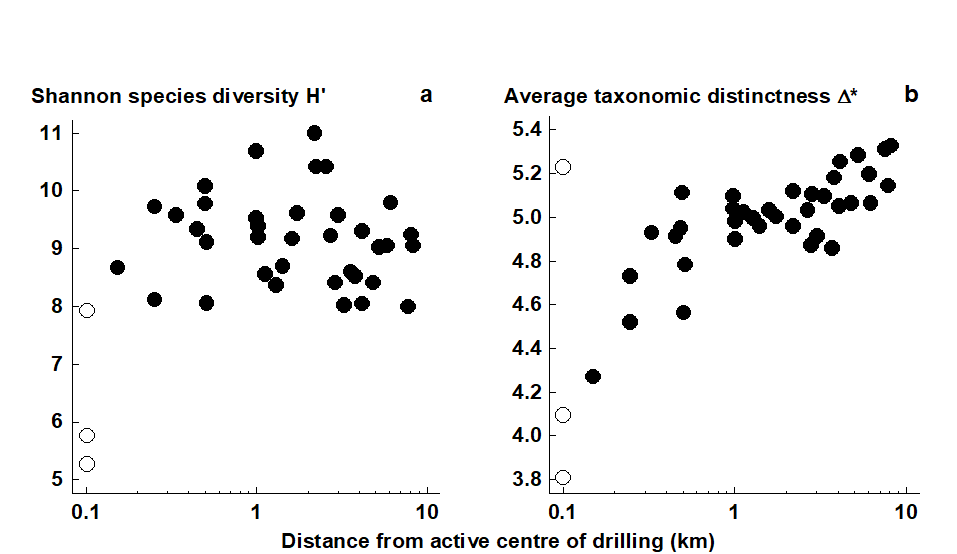
Fig. 17.3. Ekofisk macrobenthos {E}. a) Shannon diversity (H$^ \prime$) for the 39 sites (y-axis), plotted against distance from centre of drilling activity (x-axis, log scale). b) Quantitative average taxonomic distinctness $\Delta ^ \ast$ for the 39 sites, indicating a response trend not present for standard diversity indices.
A further example, from the coastal N Sea, is given by a time-series of macrobenthic samples, with data averaged over 6 locations in Tees Bay, UK, ({t}, Warwick, Ashman, Brown et al. (2002) ). Samples were taken in March and September for each of the years 1973 to 1996, and Fig. 17.4 shows the September inter-annual patterns for four (bio)diversity measures. Notable is the clear increase in Shannon diversity at around 1987/88 (Fig. 17.4b), coinciding with significant widescale changes in the N Sea planktonic system which have been reported elsewhere (e.g. Reid, Barges & Svendsen (2001) ). However, Shannon diversity is very influenced here by the high numbers of a single abundance dominant (Spiophanes bombyx), whose decline after 1987 led to greater equitability in the quantitative species diversity measures. A more far-reaching change, representative of what was happening to the community as a whole, is indicated by looking at the taxonomic relatedness statistics based only on presence/absence data. Use of simple species lists has the advantage here of ensuring that no one species can dominate the contributions to the index. Average taxonomic distinctness ($\Delta ^ +$) is seen to show a marked decline at about the time of this N Sea regime shift (Fig. 17.4c), indicating a biodiversity loss, a very different (and more robust) conclusion than that drawn from Shannon diversity.

Fig. 17.4. Tees macrobenthos {t}. (Bio)diversity indices for Tees Bay areas combined, from sediment samples in September each year, over the period 1973–96, straddling a major regime-shift in N Sea ecosystems, about 1987. a) Richness, S; b) Shannon, H$^ \prime$; c) Average taxonomic distinctness, $\Delta ^ +$, based on presence/absence and reflecting the mean taxonomic breadth of the species lists; d) Variation in taxonomic distinctness, $\Lambda ^ +$ (also pres/abs), reflecting unevenness in the taxonomic hierarchy.