1.2 Univariate techniques
For diversity indices and other single-variable extractions from the data matrix, standard statistical methods are usually applicable and the reader is referred to one of the many excellent general statistics texts (e.g. Sokal & Rohlf (1981) ). The requisite techniques for each stage are summarised in Table 1.1. For example, when samples have the structure of a number of replicates taken at each of a number of sites (or times, or conditions), computing the means and 95% confidence intervals gives an appropriate representation of the Shannon diversity (say) at each site, with discrimination between sites being demonstrated by one-way analysis of variance (ANOVA), which is a test of the null hypothesis that there are no differences in mean diversity between sites. Linking to the environment is then also relatively straightforward, particularly if the environmental variables can be condensed into one (or a small number of) key summary statistics. Simple or multiple regression of Shannon diversity as the dependent variable, against the environmental descriptors as independent variables, is then technically feasible, though rarely very informative in practice, given the over-condensed nature of the information utilised.§
Table 1.1. Univariate techniques. Summary of analyses for the four stages.
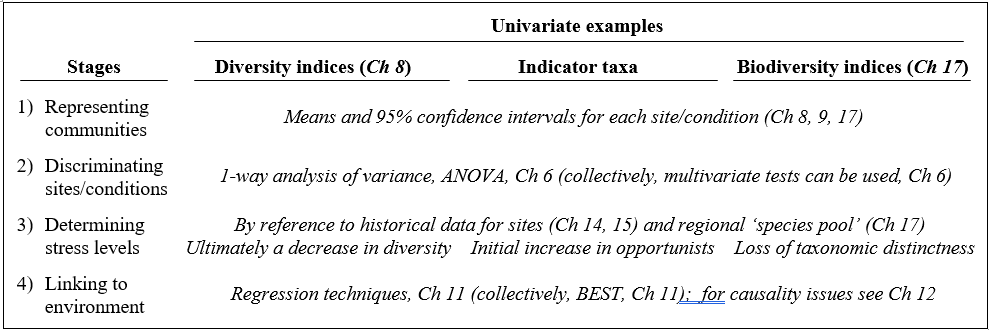
For impact studies, much has been written about the effect of pollution or disturbance on diversity measures: whilst the response is not necessarily undirectional (under the hypothesis of Huston (1979) , diversity is expected to rise at intermediate disturbance levels before its strong decline with gross disturbance), there is a sense in which determining stress levels is possible, through relation to historical diversity patterns for particular environmental gradients. Similarly, empirical evidence may exist that particular indicator taxa (e.g. Capitellids) change in abundance along specific pollution gradients (e.g. of organic enrichment). Note though that, unlike the diversity measures constructed from abundances across species, averaged in some way¶, indicator species levels will not initially satisfy the assumptions necessary for routine statistical analysis. Log transforms of such counts will help but, for most individual species, abundance across the set of samples is likely to be a poorly-behaved variable, statistically speaking. Typically, a species will be absent from many of the samples and, when present, the counts are often highly variable, with abundance probability distribution heavily right-skewed†. Thus, for all but the most common individual species, transformation is no real help and parametric statistical analyses cannot be applied to the counts, in any form. In any case, it is not valid to ‘snoop’ in a large data matrix, of typically 100–250 taxa, for one or more ‘interesting’ species to analyse by univariate techniques (any indicator or keystone species selection must be done a priori). Such arguments lead to the tenets underlying this manual:
a) community data are usually highly multivariate (large numbers of species, each subject to high statistical noise) and need to be analysed en masse in order to elicit the important biological signal and its relation to the environment;
b) standard parametric modelling is totally invalid.
Thus, throughout, little emphasis is given to representing communities by univariate measures, though some definitions of indices can be found at the start of Chapter 8, some brief remarks on hypothesis testing (ANOVA) at the start of Chapter 6, a discussion of transformations (to approximate normality and constant variance) at the start of Chapter 9, an example given of a univariate regression between biota and environment in Chapter 11, and a more extensive discussion of sampling properties of diversity indices, and biodiversity measures based on taxonomic relatedness, makes up Chapter 17. Finally, Chapter 14 gives a series of detailed comparisons of univariate with distributional and multivariate techniques, in order to gauge their relative sensitivities and merits in a range of practical studies.
§ Though most of this chapter assumes that diversity indices will be treated independently (hence ANOVA and regression models), an underused possibility is illustrated at the end of Chapter 8, that a set of differing univariate diversity measures be treated as a multivariate data matrix, with ‘dissimilarity’ defined as normalised Euclidean distance, and input to the same tools as used for multivariate community data (thus ANOSIM and BEST analyses).
¶ And thus subject to the central limit theorem, which will tend to induce statistical normality.