3.3 Example: Bristol Channel zooplankton
Collins & Williams (1982) perform hierarchical cluster analyses of zooplankton samples, collected by double oblique net hauls at 57 sites in the Bristol Channel UK, for three different seasons in 1974 {B}. This was not a pollution study but a baseline survey carried out by the Plymouth laboratory, as part of a major programme to understand and model the ecosystem of the estuary. Fig. 3.2 is a map of the sample locations, sites 1-58 (site 30 not sampled).
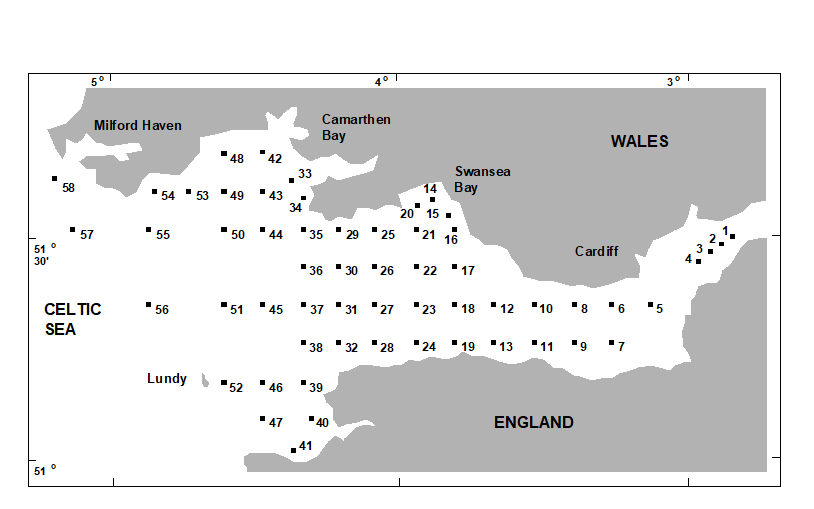 Fig. 3.2 Bristol Channel zooplankton {B}. Sampling sites.
Fig. 3.3 shows the results of a hierarchical clustering using group-average linking of the 57 sites. The raw data were expressed as numbers per cubic metre for each of 24 holozooplankton species, and Bray-Curtis similarities calculated on $\sqrt{}\sqrt{}$-transformed densities. From the resulting dendrogram, Collins and Williams select the four groups determined at a 55% similarity level and characterise these as true estuarine (sites 1-8, 10, 12), estuarine and marine (9, 11, 13-27, 29), euryhaline marine (28, 31, 33-35, 42-44, 47-50, 53-55) and stenohaline marine (32, 36-41, 45, 46, 51, 52, 56-58). A corresponding clustering of species and a re-ordering of the rows and columns of the original data matrix allows the identification of a number of species groups characterising these main site clusters, as is seen later (Chapter 7).
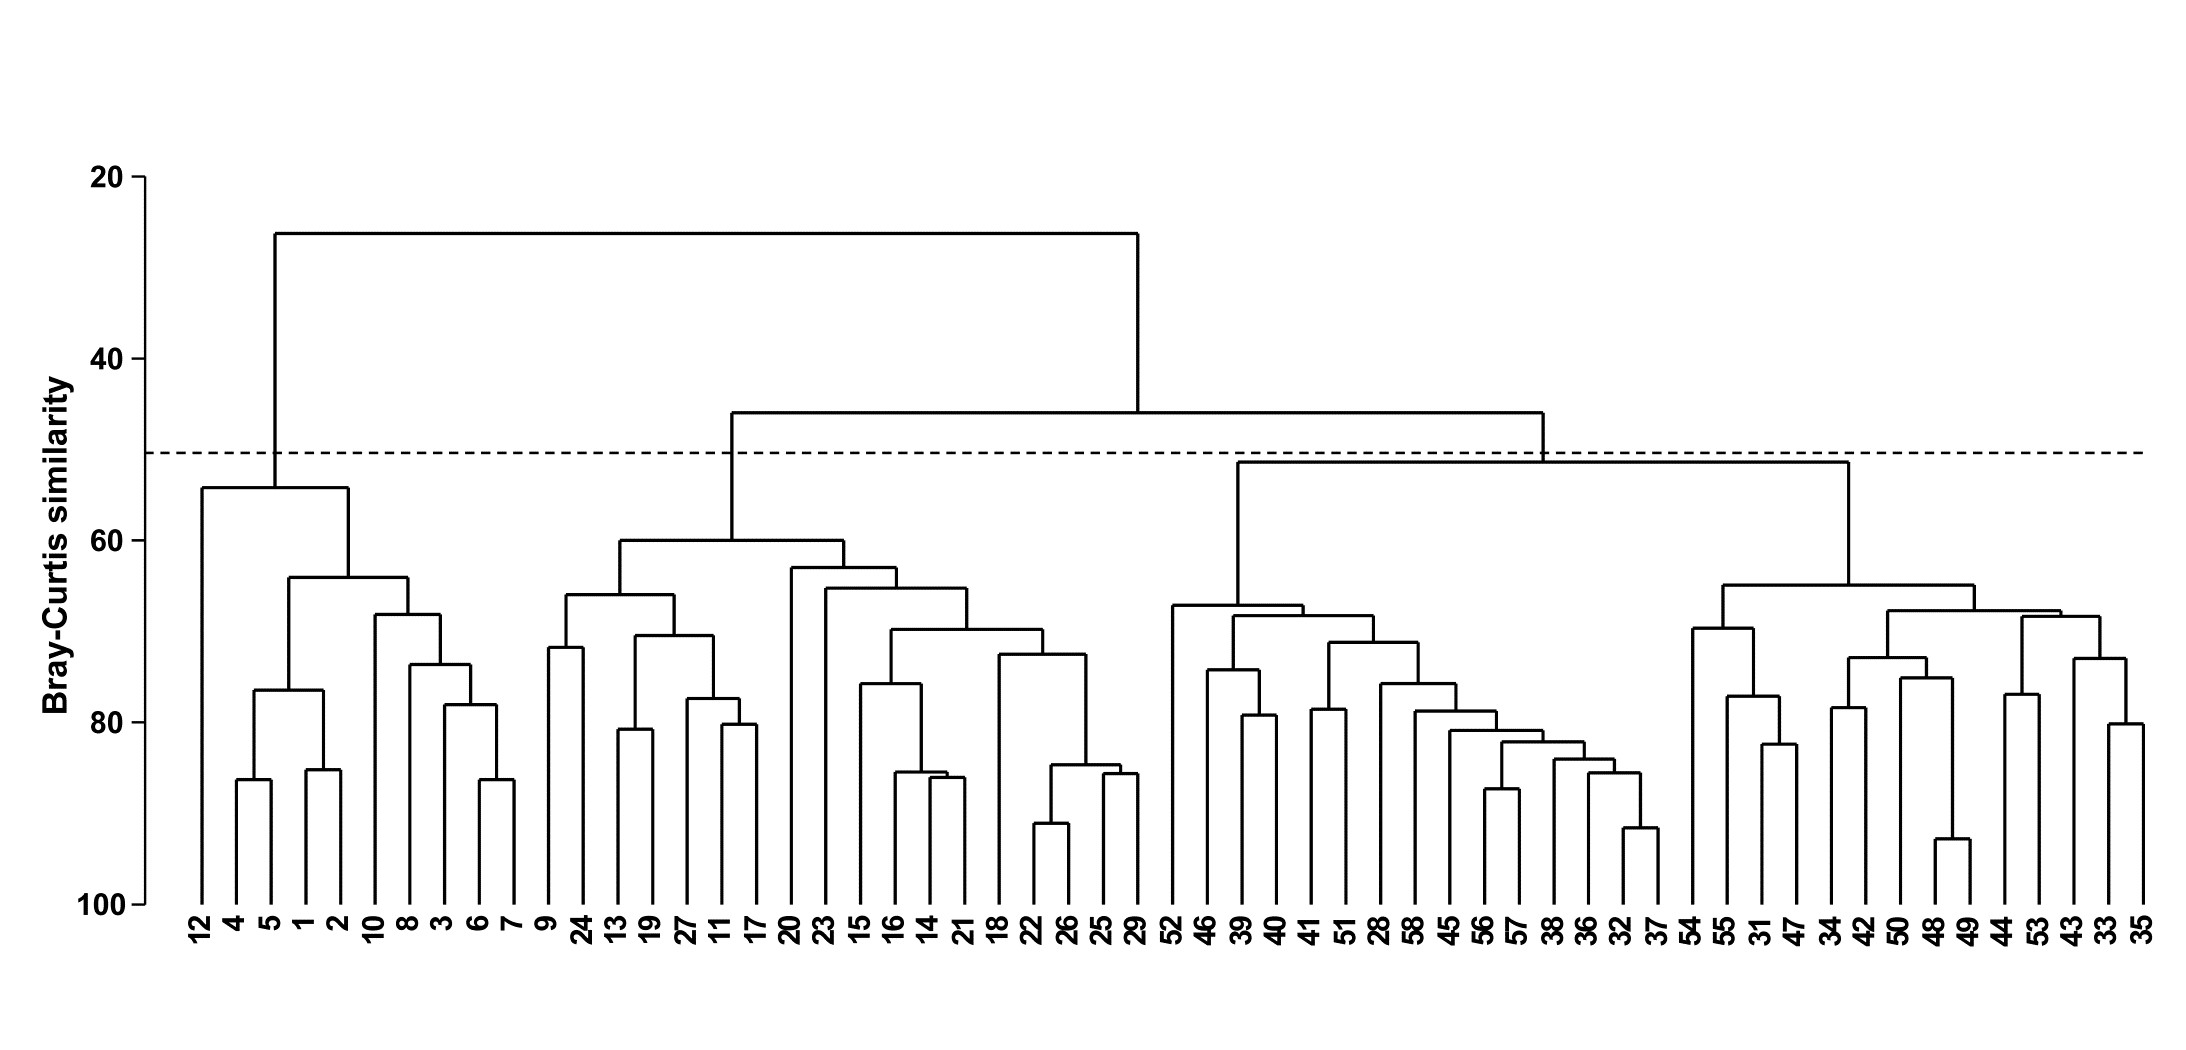
Fig. 3.3. Bristol Channel zooplankton {B}. Dendrogram for hierarchical clustering of the 57 sites, using group-average linking of Bray-Curtis similarities calculated on $\sqrt{}\sqrt{}$-transformed abundance data. The three groups produced by an (arbitrary) threshold similarity of 50% are shown.
The dendrogram provides a sequence of fairly convincing groups; once each of the four main groups has formed it remains separate from other groups over a relatively large drop in similarity. Even so, a cluster analysis gives an incomplete and disjointed picture of the sample pattern. Remembering the analogy of the ‘mobile’, it is not clear from the dendrogram alone whether there is any natural sequence of community change across the four main clusters (implicit in the designations true estuarine, estuarine and marine, euryhaline marine, stenohaline marine). For example, the stenohaline marine group could just as correctly have been rotated to lie between the estuarine and marine and euryhaline marine groups. In fact, there is a strong (and more-or-less continuous) gradient of community change across the region, associated with the changing salinity levels. This is best seen in an ordination of the 57 samples on which are superimposed the salinity levels at each site; this example is therefore returned to in Chapter 11.