14.3 Examples 4, 5, 6 and 7
Example 4: Fish communities from coral reefs in the Maldives
In the Maldive islands,
Dawson-Shepherd, Warwick, Clarke et al. (1992)
compared reef-fish assemblages at 23 coral reef-flat sites {M}, 11 of which had been subjected to coral mining for the construction industry and 12 were non-mined controls. The reef-slopes adjacent to these flats were also surveyed.
Univariate indices
Using ANOVA, no significant differences in diversity (Fig. 14.8) were observed between mined and control sites, with no differences either between reef flats and slopes.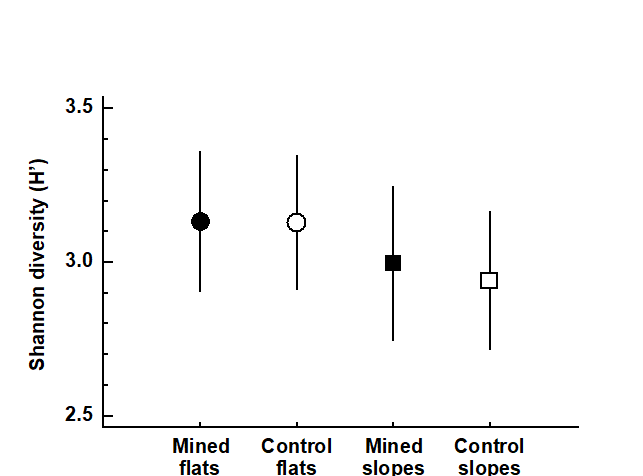
Fig. 14.8. Maldive Islands, coral-reef fish {M}. Shannon species diversity (means and 95% confidence intervals) at mined (closed symbols) and control (open symbols) sites, for both reef flats (circles) and reef slopes (squares).
Graphical/distributional plots
No significant differences could be detected between mined and control sites, in k-dominance curves for either species abundance or biomass. Fig. 14.9 displays the mean curves for reef-flat data pooled across the replicates for each condition.
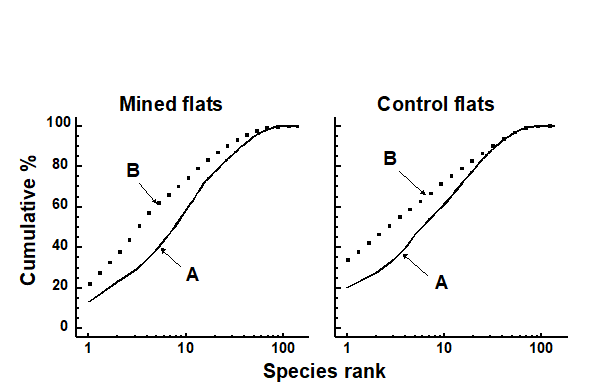
Fig. 14.9. Maldive Islands, coral-reef fish {M}. Average k-dominance curves for abundance and biomass at mined and control reef-flat sites.
Multivariate analysis
The MDS (Fig.14.10) clearly distinguished mined from control sites on the reef-flats, and also to a lesser degree even on the slopes adjacent to these flats, where ANOSIM confirmed the significance of this difference.

Fig. 14.10. Maldive Islands, coral-reef fish {M}. MDS of 4th root-transformed species abundance data. Symbols as in Fig. 14.8, i.e. circles = reef-flat, squares = slope, solid = mined, open = control (stress = 0.09).
Conclusions
There were clear differences in community composition due to mining activity revealed by multivariate methods, even on the reef-slopes adjacent to the mined flats, but these were not detected at all by univariate or graphical/ distributional techniques, even on the flats, where the separation in the MDS is so obvious.
Example 5: Macro- and meiobenthos from Isles of Scilly seaweeds
The entire metazoan fauna (macrofauna + meiofauna) has been analysed from five species of intertidal macro-algae (Chondrus, Laurencia, Lomentaria, Cladophora, Polysiphonia) each collected at eight sites near low water from rocky shores on the Isles of Scilly {S} (Fig. 14.11).
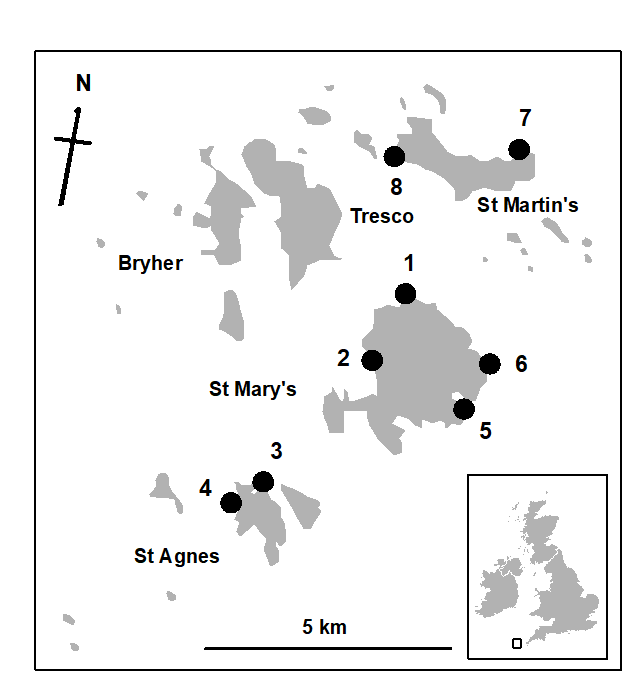
Fig. 14.11. Scilly Isles {S}. Map of the sites (1-8) from each of which 5 seaweed species were collected.
Univariate indices
The meiofauna and macrofauna showed clearly different diversity patterns with respect to weed type; for the meiofauna there was a trend of increasing diversity from the coarsest (Chondrus) to the finest (Polysiphonia) weed, but for the macrofauna there was no clear trend and Polysiphonia had the lowest diversity (Fig. 14.12).

Fig. 14.12. Isles of Scilly seaweed fauna {S}. Shannon diversity (mean and 95% confidence intervals) for the meiofauna and macrofauna of different weed species: Ch = Chondrus, La = Laurencia, Lo = Lomentaria, Cl = Cladophora, Po = Polysiphonia.
Graphical/distributional plots
These differences in meiofauna and macrofauna species diversity profiles were also reflected in the k-dominance curves (Fig. 14.13) which had different sequencing for these two faunal components, for example the Polysiphonia curve was the lowest for meiofauna and highest for macrofauna.
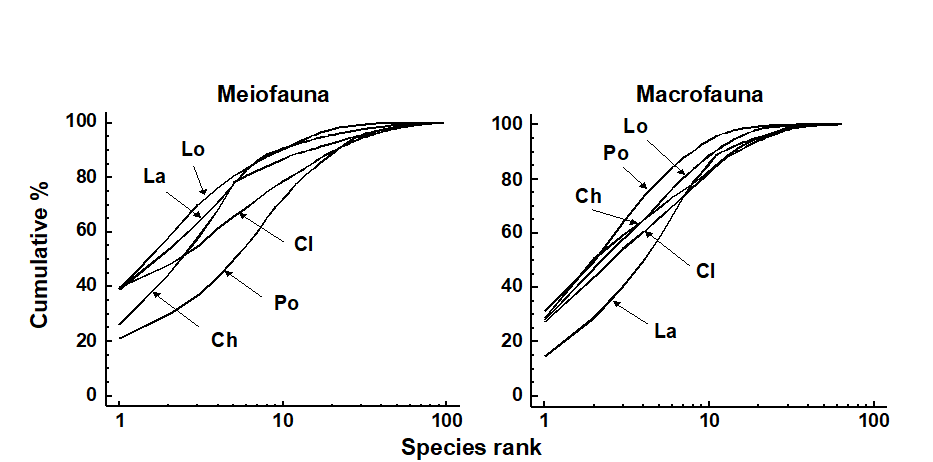
Fig. 14.13. Isles of Scilly seaweed fauna {S}. k-dominance curves for meiofauna (left) and macrofauna (right). Ch = Chondrus, La = Laurencia, Lo = Lomentaria, Cl = Cladophora, Po = Polysiphonia.
Multivariate analysis
The MDS plots for meiobenthos and macrobenthos were very similar, with the algal species showing very similar relationships to each other in terms of their meiofaunal and macrofaunal community structure (see Fig. 13.7, in which the shading and symbol conventions for the different weed species are the same as those in Fig. 14.12). Two-way crossed ANOSIM (factors: weed species and site), using the form without replicates (page 6.8), showed all weed species to be significantly different from each other in the composition of both macrofauna and meiofauna.
Conclusions
The MDS was more sensitive than the univariate or graphical methods for discriminating between weed species. Univariate and graphical methods gave different results for macrobenthos and meiobenthos, whereas for the multivariate methods the results were similar for both.
Example 6: Meiobenthos from the Tamar Estuary, S.W. England
Austen & Warwick (1989) compared the structure of the two major taxonomic components of the meiobenthos, nematodes and harpacticoid copepods, in the Tamar estuary {R}. Six replicate samples were taken at a series of ten intertidal soft-sediment sites (Fig. 14.14).
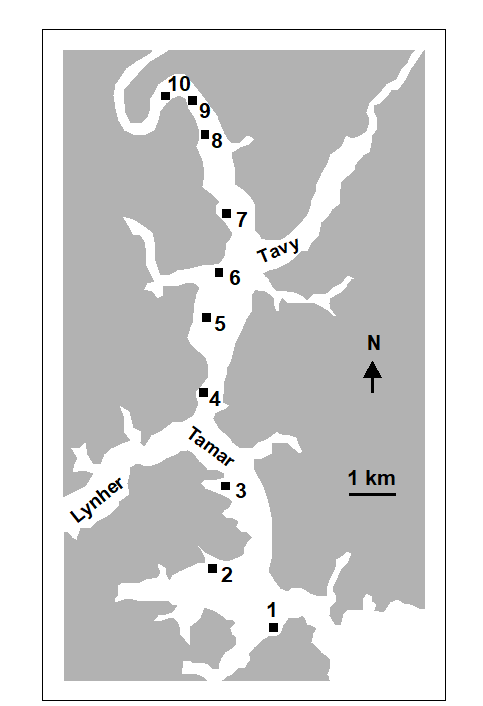
Fig. 14.14. Tamar estuary meiobenthos {R}. Map showing locations of 10 intertidal mud-flat sites.
Graphical/distributional plots
The average k-dominance curves showed no clear sequencing of sites for the nematodes, for example the curve for site 1 was closely coincident with that for site 10 (Fig. 14.15). For the copepods, however, the curves became increasingly elevated from the mouth to the head of the estuary. However, for both nematodes and copepods, many of the curves were not distinguishable from each other.
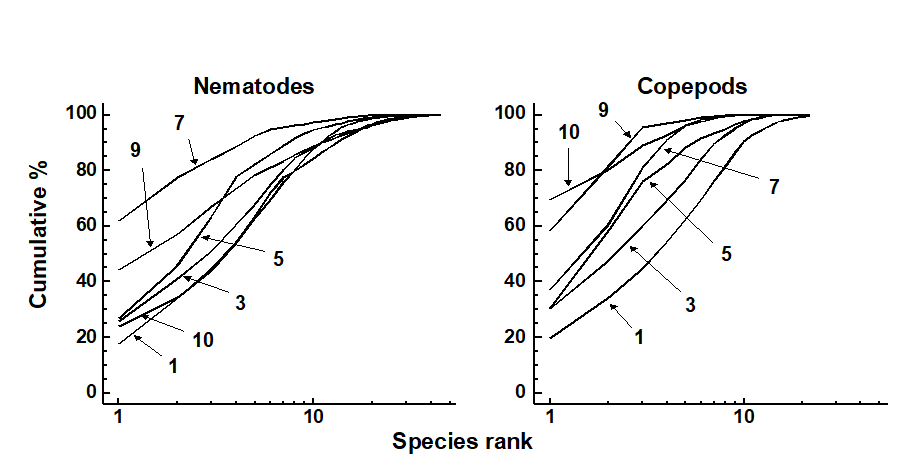
Fig. 14.15. Tamar estuary meiobenthos {R}. k-dominance curves for amalgamated data from 6 replicate cores for nematode and copepod species abundances. For clarity of presentation, some sites have been omitted.
Multivariate analysis
In the MDS, both nematodes and copepods showed a similar (arched) sequencing of sites from the mouth to the head of the estuary (Fig. 14.16). ANOSIM showed that the copepod assemblages were significantly different in all pairs of sites, and the nematodes in all pairs except 6/7 and 8/9.
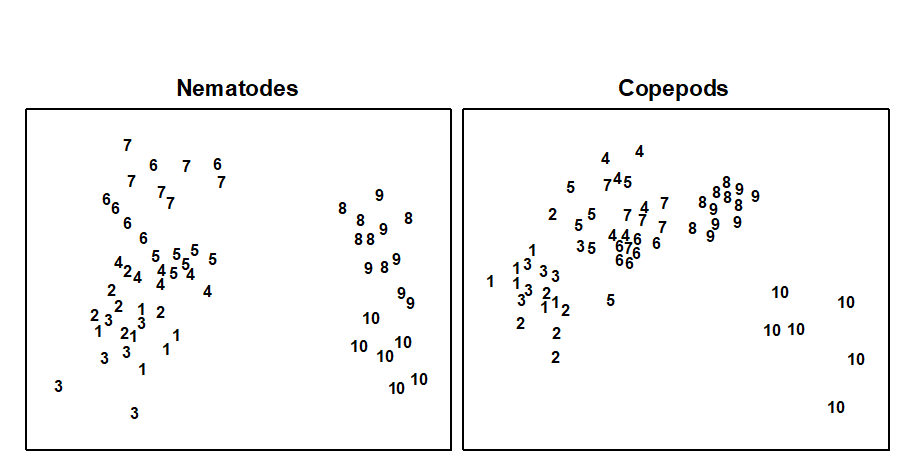
Fig. 14.16. Tamar estuary meiobenthos {R}. MDS of 4th root-transformed nematode and copepod species abundance data for six replicate cores at each of 10 stations.
Conclusions
The multivariate technique was more sensitive in discriminating between sites, and gave similar patterns for nematodes and copepods, whereas graphical methods gave different patterns for the two taxa. For nematodes, factors other than salinity seemed to be more important in determining diversity profiles, but for copepods salinity correlated well with diversity.
Example 7: Meiofauna from Eaglehawk Neck sandflat, Tasmania
This example of the effect of disturbance by burrowing and feeding of soldier crabs {T} was dealt with in some detail in Chapter 12. For nematodes, univariate, graphical and multivariate methods all distinguished disturbed from undisturbed sites. For copepods only the multivariate methods did. Univariate and graphical methods indicated different responses for nematodes and copepods, whereas the multivariate methods indicated a similar response for these two taxa.