4.3 Example: Garroch Head macrofauna
Fig. 4.1 shows the result of applying PCA to square-root transformed macrofaunal biomass data from the 65 species¶ found in subtidal sediments at 12 sites (1-12) along an E-W transect in the Firth of Clyde, Scotland ({G}, map at Fig. 1.5). A central site of the transect (site 6) is an accumulating sewage-sludge dump-ground and is subject to strong impacts of organic enrichment and heavy metal concentrations.
It makes sense to transform the biomass values, for much the same reasons as for the cluster analyses of Chapter 3, so that analysis is not dominated by large biomass values from a small number of species; here a mild square-root transform was adequate to avoid the PCA becoming over-dependent on a few outliers. There is also no need to normalise species variables: they are on comparable and meaningful measurement scales (of biomass), so PCA will naturally give more weight to species with larger (transformed) biomass.
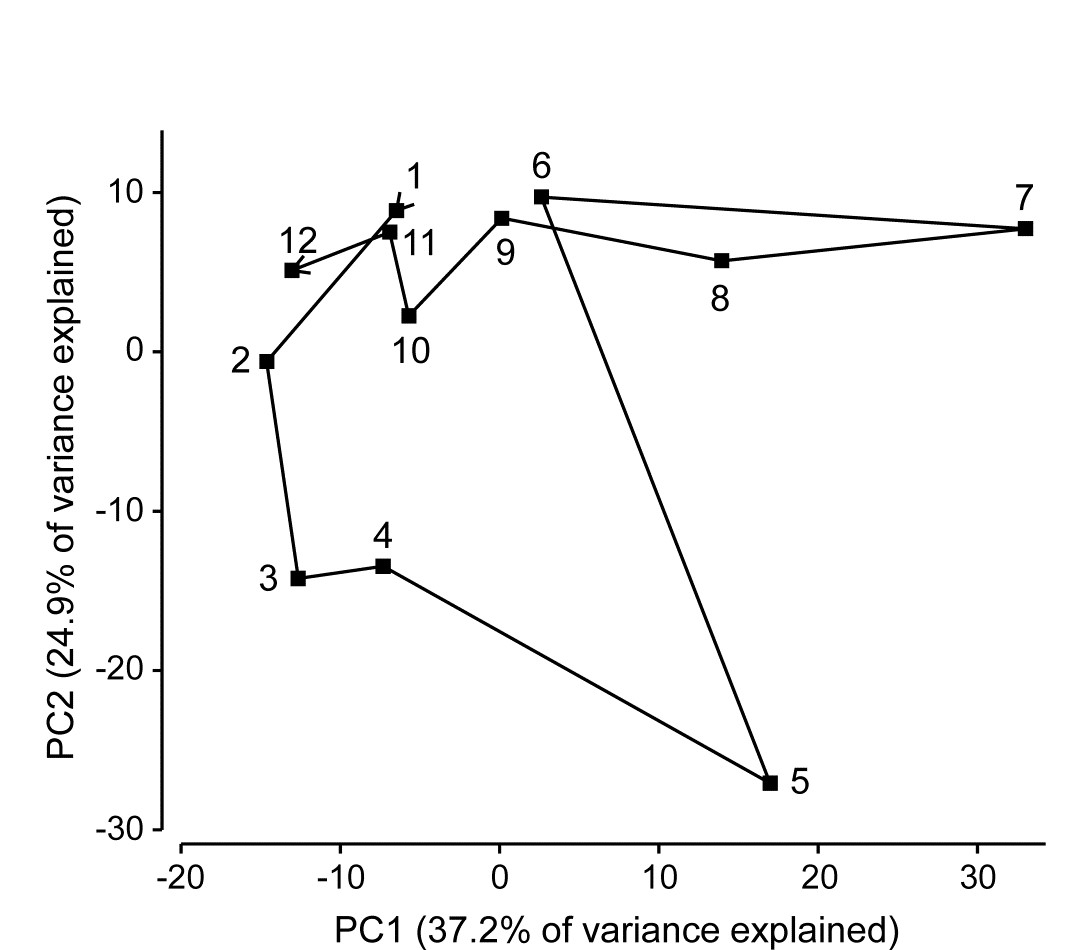
Fig. 4.1. Garroch Head macrofauna {G}. 2-dimensional PCA ordination of square-root transformed biomass of 65 species at 12 sites (1-12) along a transect over the sludge disposal ground at site 6; points joined in transect order (see map in Fig. 1.5).
A total of 11 PC’s are sufficient to capture all the information in this sample matrix, because there are only n=12 samples. (Had n been greater than p, then p PCs would theoretically have been needed to do this, the full PCA then being simply a rotation of the original 65 species axes). However, many fewer than 11 axes are needed to ‘capture’ much of the variability in samples here, the first two axes in Fig. 4.1 explaining 62% of the total variance (a third and fourth would have added another 20% but made no fundamental changes to the broad pattern of this ordination).
There is a puzzling feature to this pattern: the PCA points are joined in their transect order and a natural and interpretable progression of community structure is seen on approach to the dumpsite (1-5) and also on leaving it (7-12). However, site 6 (the dumpsite itself) appears close to sites 1 and 9-12 at the extremes of the transect, suggesting some commonality of the assemblages. Yet examination of the original biomass matrix shows that site 6 has no species in common at all with sites 1 and 9-12! And examination of the environmental data for these sites (on organics, heavy metals and water depth), seen in the later Table 11.1, confirms the expected pattern of contaminant levels in the sediments being greatest at site 6, and least at the transect end-points. The issue here is not that a 2-dimensional PCA is an inadequate description, and that in higher dimensions site 6 would appear well separated from the transect end-points - it does not do so - but that the implicit dissimilarity measure that PCA uses is Euclidean distance, and that is a poor descriptor of differences in biological communities. In other words, the ordination technique itself may not, in some cases, be an inherently defective one, if a high percentage of the original variance is explained in the low-d picture, but the problem is that it starts in the wrong place - with a defective measure of community dissimilarity. The reasons for this are covered in much more detail later, when Euclidean and other resemblance measures are compared for this (and other) data, e.g. Fig. 16.10 on page 16.6.
¶ Later analysis of the count data from this study uses 84 species; 19 of them were too small-bodied to have a weighable biomass.