9.4 Recommendations
The transformation sequence in a multivariate analysis, corresponding to a progressive downweighting of the common species, is effectively:
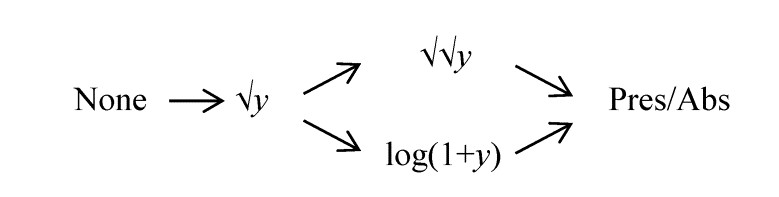
The choice of transformation from this sequence can affect the conclusions of an analysis, and in many respects it is more a biological than a statistical question: which view of the community do we wish to take (shallow or deep), given that there are potentially many different 2-dimensional summaries of this high-dimensional data?
Statistical considerations do enter, however, particularly in relation to the reliability of sampling. At one extreme, a presence/absence analysis can give too much weight to the chance capture of species only found occasionally as single individuals. At the other extreme, an abundance MDS plot can be distorted by the capture of larvae or opportunist colonisers with a strong degree of spatial clumping, such that replicate samples at the same time/location give counts from absent to thousands. Under certain conditions, e.g. when the data matrix consists of real counts (not adjusted densities per area of sediment or volume of water) and there are replicate samples which will allow the degree of clumping of individuals to be quantified, the next section describes a useful way of removing the effects of this clumping (by dispersion weighting). This replaces the statistical need for transformation (to reduce highly erratic counts over replicates) but not necessarily the biological need, which remains that of balancing contributions from (consistently) abundant with less abundant species.
If conditions do not allow dispersion weighting (e.g. absence of replicates), the practical choice of transformation is often between moderate ($\sqrt{}$) and rather severe ($\sqrt{} \sqrt{}$ or log), retaining the quantitative information but downplaying the species dominants. (After dispersion weighting the severest transformations are not usually necessary). Note that the severe transformations come close to reducing the original data to about a 6 point scale: 0 = absent, 1 = one individual, 2 = handful, 3 = sizeable number, 4 = abundant, ≥5 = very abundant. Rounding the transformed counts to this discrete scale will usually make little or no difference to the multivariate ordination (though this would not be the case for some of the univariate and graphical methods of Chapter 8). The scale may appear crude but is not unrealistic; species densities are often highly variable over small-scale spatial replication, and if the main requirement is a multivariate description, effort expended in deriving precise counts from a single sample could be better spent in analysing more samples, to a less exacting level of detail. This is also a central theme of Chapter 10.