16.1 Introduction
To motivate the first method of this chapter look again at the analysis of macrobenthic samples from the Bay of Morlaix {A}, before and after the Amoco-Cadiz oil spill. The MDS of Fig. 16.1 shows a clear signal of community change through time, a combination of cyclical seasonal fluctuations (the samples are approximately quarterly) with the major perturbation of the oil spill after approximately a year, and a partial recovery over the next four years. The intricate and informative picture is based on a matrix of 257 species but the question naturally arises as to whether all these species are influential in forming the temporal pattern. This cannot be the case, of course, because many species are very uncommon. The later Fig. 16.3a shows an identical MDS plot based on only 125 species, the omitted ‘least important’ 132 species accounting for only 0.2% of the total abundance and, on average, being absent from all 5 replicate samples on 90% of the 21 sampling times. However, the question still remains: do all the 125 species contribute to the MDS or is the pattern largely determined by a small number of highly influential species? If the latter, an MDS of that small species subset should generate an ordination that looks very like Fig. 16.1, and this suggests the following approach ( Clarke & Warwick (1998a) ).
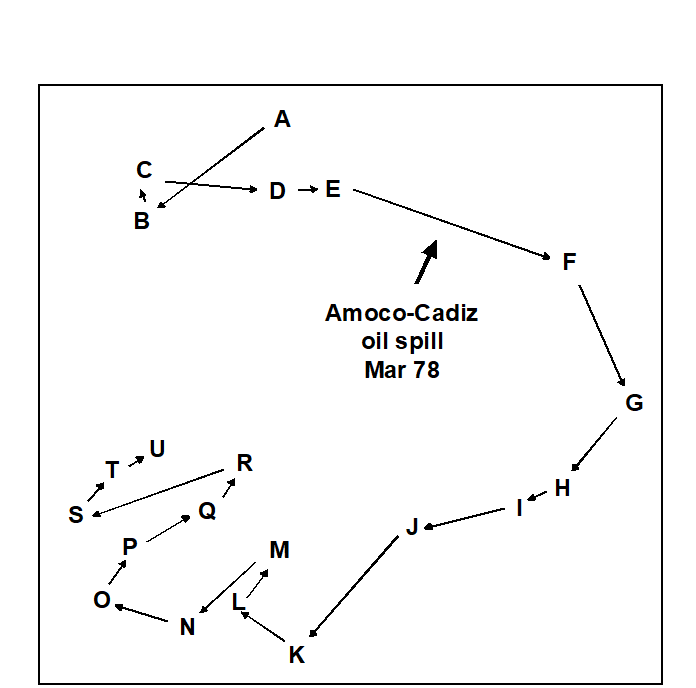
Fig. 16.1. Amoco-Cadiz oil spill {A}. MDS for 257 macrobenthic species in the Bay of Morlaix, for 21 sampling times (A, B, C, …, U; see legend to Fig. 10.4 for precise dates). The ordination is based on Bray-Curtis similarities from fourth root-transformed abundances and the samples were taken at approximately quarterly intervals over 5 years, reflecting normal seasonal cycles and the perturbation of the oil spill (stress = 0.09).