17.4 Other relatedness measures
The remainder of this chapter deals only with data in the form of a species list for a locality (presence/absence data). There is a substantial literature on measures incorporating, primarily, phylogenetic relationships amongst species (see references in the review-type papers of
Faith (1994)
and
Humphries, Williams & Vane-Wright (1995)
). The context is conservation biology, with the motivation being the selection of individual species, or sets of species (or reserves), with the highest conservation priority, based on the unique evolutionary history they represent, or their complementarity to existing well-conserved species (or reserves).
Warwick & Clarke (2001)
draw a potentially useful distinction of terminology between this individual species-focused conservation context and the use, as in this chapter, of relatedness information to monitor differences in community-wide patterns in relation to changing environmental conditions. They suggest that the term taxonomic/phylogenetic distinctiveness (of a species) is reserved for weights assigned to individual species, reflecting their priority for conservation; whereas taxonomic/phylogenetic distinctness (of a community) summarises features of the overall hierarchical structure of an assemblage (the spread, unevenness etc. of the classification tree).
Phylogenetic diversity (PD)
In the distinctiveness context, Vane-Wright, Humphries & Williams (1991) , Williams, Humphries & Vane-Wright (1991) and May (1990) introduced measures based only on the topology (‘elastic shape’) of a phylogenetic tree, appropriate when branch lengths are entirely unknown. Faith (1992) and Faith (1994) defined a phylogenetic diversity (PD) measure based on known branch lengths: PD is simply the cumulative branch length of the full tree. Whether this is thought of as representing the total evolutionary history, the genetic turnover or morphological richness, it is an appealingly simple statistic. Unfortunately, Fig. 17.5 demonstrates some of the disadvantages of using these measures in a distinctness context. The figure compares only samples (lists) with the same number of species (7), at four hierarchical levels (say, species within genera within families, all in one order), so that each step length is set to 33.3. Fig. 17.5b and c have the same tree topology, yet we should not consider them to have the same average (or total) distinctness, since each species is more taxonomically similar to its neighbours in b than c (reflected in $\Delta ^ +$ values of 33.3 and 66.6 respectively). Similarly, contrasting Fig. 17.5d and e, the total PD is clearly identical, the sum of all the branch lengths being 333 in both cases, but this does not reflect the more equitable distribution of species amongst higher taxa in d than e ($\Delta ^ +$ does, however, capture this intuitive element of biodiversity, with respective values of 52 and 43).
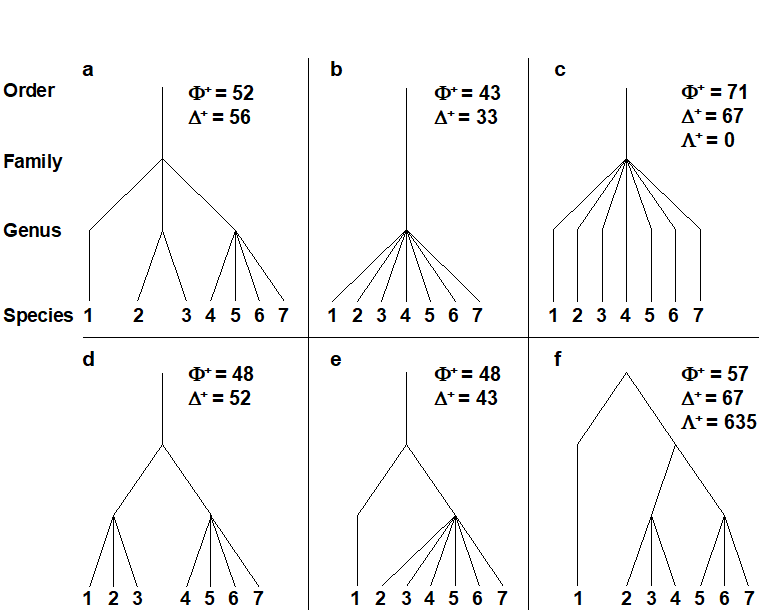
Fig. 17.5. a)-f) Example taxonomic hierarchies for presence/ absence data on 7 species (i.e. of fixed species richness), with 4 levels and 3 step lengths (thus each of 33.3, though the third step only comes into play for plot f). $\Phi ^ +$: average phylogenetic diversity,$\Delta ^ +$: average taxonomic distinctness, $\Lambda ^ +$: variation in TD. The plots show, inter alia: the expected ‘biodiversity’ decrease from a) to d) and e) to b) (in both $\Delta ^ +$ and $\Phi ^ +$), and from d) to e) (but only in $\Delta ^ +$, not in $\Phi ^ +$); unevenness of f) in relation to c), reflected in increased $\Lambda ^ +$ though unchanged $\Delta ^ +$.
Average PD
More importantly, there is another clear reason why phylogenetic diversity PD is unsuitable for monitoring purposes. Firstly, note that PD itself is a total rather than average property; as new species are added to the list it always increases. This makes PD highly dependent on species richness S and thus sampling effort, a demonstration of which can be seen in Fig. 17.2d (and the later Fig. 17.9a), a near straight line relationship of PD with S. This is to be expected, and a better equivalent to average taxonomic distinctness (AvTD, $\Delta ^ +$) would be average phylogenetic diversity (AvPD), defined as the ratio:
$$ \Phi ^ + = PD / S \tag{17.5} $$
This is a very intuitive summary of average distinctness, being the contribution that each species makes on average to the total tree length, but unfortunately it does not have the same lack of dependence on sampling effort that characterises $\Delta ^ +$. Fig. 17.2e (and the later Fig. 17.9b) show that its value decreases markedly as the number of species (S) increases, making it misleading to compare AvPD values across studies with differing levels of sampling effort.
‘Total’ versus ‘average’ measures
Note the distinction here between total and average distinctness measures. AvPD ($\Phi ^ +$) is the analogue of AvTD ($\Delta ^ +$), both being ways of measuring the average taxonomic breadth of an assemblage (a species list), for a given number of species. $\Delta ^ +$ will give the same value (on average) whatever that number of species; $\Phi ^ +$ will not. Total PD measures the total taxonomic breadth of the assemblage and has a direct analogue in total taxonomic distinctness:
$$ TTD = S \times \Delta ^ + = \sum _ i \left[ \left( \sum _ {j \ne i} \omega _ {ij} \right) / \left(S – 1 \right) \right] \tag{17.6} $$
Explained in words, this is the average taxonomic distance from species i to every other species, summed over all species, i = 1, 2, …, S. (Taking an average rather than a sum gets you back to AvTD, $\Delta ^ +$.) TTD may well be a useful measure of total taxonomic breadth of an assemblage, as a modification of species richness which allows for the species inter-relatedness, so that it would be possible, for example, for an assemblage of 20 closely-related species to be deemed less ‘rich’ than one of 10 distantly-related species. In general, however, like total PD, total TD will tend to track species richness rather closely, and will only therefore be useful for tightly controlled designs in which effort is identical for the samples being compared, or sampling is sufficiently exhaustive for the asymptote of the species-area curve to have been reached (i.e. comparison of censuses rather than samples).
Variation in TD
Finally, a comparison of Fig. 17.5c and f shows that the scope for extracting meaningful biodiversity indices (unrelated to richness) from simple species lists has not yet been exhausted. Average taxonomic distinctness is the same in both cases ($\Delta ^ + = 66.6$) but the tree constructions are very different, the former having consistent, intermediate taxonomic distances between pairs of species, in comparison with the latter’s disparate range of small and large values. This can be conveniently summarised in a further statistic, the variance of the taxonomic distances {$\omega_{ij}$} between each pair of species i and j, about their mean value $\Delta ^ +$:
$$ \Lambda ^ + = \left[ \sum \sum _ {i < j} ( \omega _ {ij} - \Delta ^ + ) ^ 2 \right] / \left[ S (S - 1)/2 \right] \tag{17.7} $$
termed the variation in taxonomic distinctness, VarTD. Its behaviour in a practical application will be examined later in the chapter¶, but note for the moment that it, too, appears to have the desirable sampling property of (approximate) lack of dependence of its mean value on sampling effort (see Fig. 17.2f).
¶ The PRIMER DIVERSE routine has options to compute the full range of relatedness-based biodiversity measures discussed in this chapter: $\Delta$, $\Delta ^ \ast$, $\Delta ^ +$, TTD, $\Lambda ^ +$, PD, $\Phi ^ +$, simultaneously for all the samples in a species matrix. It returns the values to a worksheet which can be displayed as Scatter Plots, Histograms, Draftsman Plots etc, analysed in a multivariate way (with the indices as the variables, page 8.7) or by conventional univariate tests, either in PERMANOVA on Euclidean distance matrices from single indices ( Anderson, Gorley & Clarke (2008) ) or exported to ANOVA software. These DIVERSE options require the availability of an aggregation file, detailing which species map to which genus, families etc, in exactly the same format needed for the Aggregate routine used to perform higher taxonomic level analyses in Chapter 10.