1.5 Example: Loch Linnhe macrofauna
Table 1.4. Loch Linnhe macrofauna {L}. Abundance/biomass matrix (part only); one (pooled) set of values per year (1963–1973).
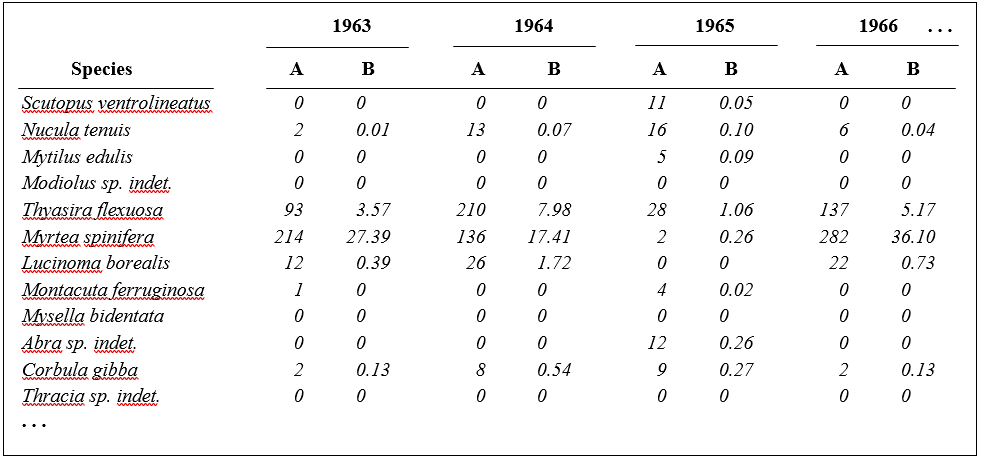
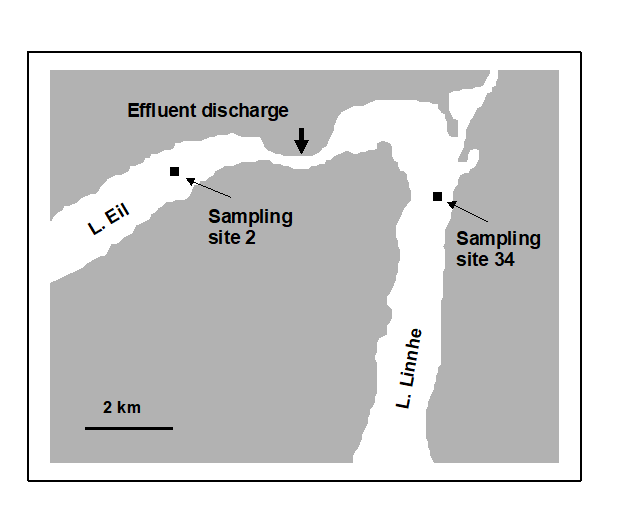
Fig. 1.3. Loch Linnhe and Loch Eil, Scotland {L}. Map of site 34 (Linnhe) and site 2 (Eil), sampled annually over 1963–1973.
Pearson (1975) describes a time series of macrobenthic community samples, taken over the period 1963–1973 inclusive, at two sites in a sea loch system on the west coast of Scotland ({L}, Fig. 1.3.) Pooling to a single sample for each of the 11 years resulted in abundance and biomass matrices of 111 rows (species) and 11 columns (samples), a small part of which is shown in Table 1.4.¶ Starting in 1966, pulp-mill effluent was discharged to the sea lochs (Fig. 1.3), with the rate increasing in 1970 and a significant reduction taking place in 1972 ( Pearson (1975) ). The top left-hand plot of Fig 1.4 shows the Shannon diversity of the macrobenthic samples over this period, and the remaining plots the ABC curves for each year.† There appears to be a consistent change of structure from one in which the biomass curve dominates the abundance curve in the early years, to the curves crossing, reversing altogether and then finally reverting to their original form.
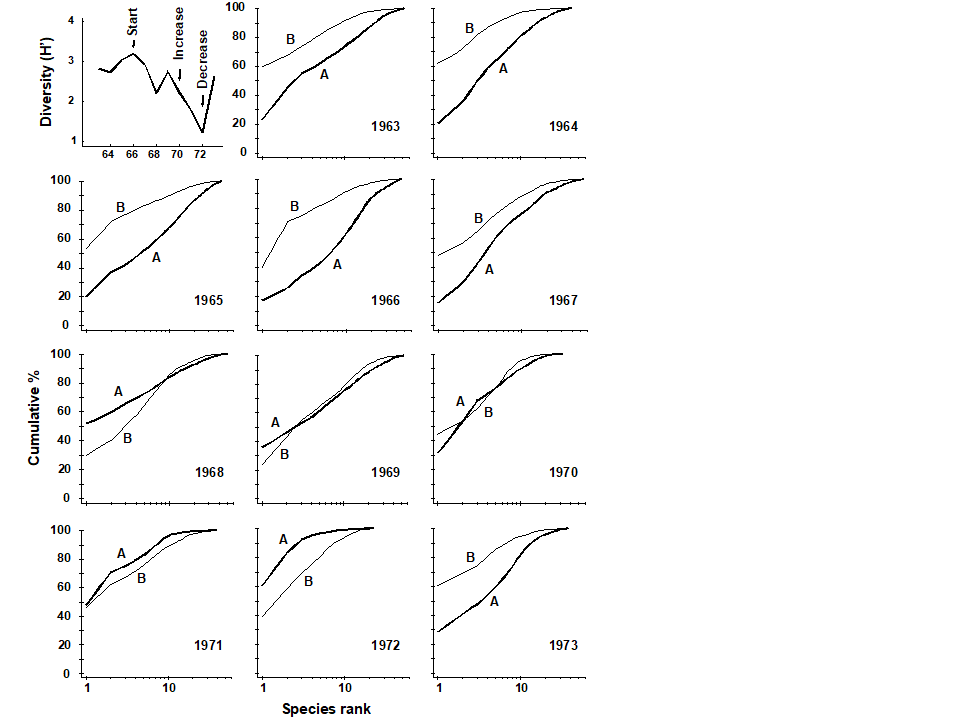 Fig. 1.4. Loch Linnhe macrofauna {L}. Top left: Shannon diversity over the 11 annual samples, also indicating timing of start of effluent discharge and a later increase and decrease in level; remaining plots show ABC curves for the separate years 1963–1973 (B = biomass, thin line; A = abundance, thick line).
¶ It is displayed in this form purely for illustration; this is not a valid file format for PRIMER, which requires the abundance and biomass information to be in separate (same-shape) arrays.
† Computed from the PRIMER Dominance Plot routine.