6.8 Example: Mesocosm experiment (two-way crossed case with no replication)
Although the above test may still function if a few random cells in the 2-way layout have only a single replicate, its success depends on reasonable levels of replication overall to generate sufficient permutations. A commonly arising situation in practice, however, is where the 2-way design includes no replication at all.¶ Typically this could be a sites $\times$ times field study (see next section) but it may also occur in experimental work: an example is given by Austen & Warwick (1995) of a laboratory mesocosm study in which a complex array of treatments was applied to soft-sediment cores taken from a single, intertidal location in the Westerschelde estuary, Netherlands, {w}. A total of 64 cores were randomly divided between 4 mesocosm basins, 16 to a basin.
The experiment involved 15 different nutrient enrichment conditions and one control, the treatments being applied to the surface of the undisturbed sediment cores. After 16 weeks controlled exposure in the mesocosm environment, the meiofaunal communities in the 64 cores were identified, and Bray-Curtis similarities on root-transformed abundances gave the MDS of Fig. 6.8. The full set of 16 treatments was repeated in each of the 4 basins (blocks), so the structure is a 2-way treatments $\times$ blocks layout with only one replicate per cell. Little, if any, of this structure is apparent from Fig. 6.8 and a formal test of the null hypothesis
H$_o$: there are no treatment differences (but allowing the possibility of basin effects)
is clearly necessary before any sort of interpretation is attempted.
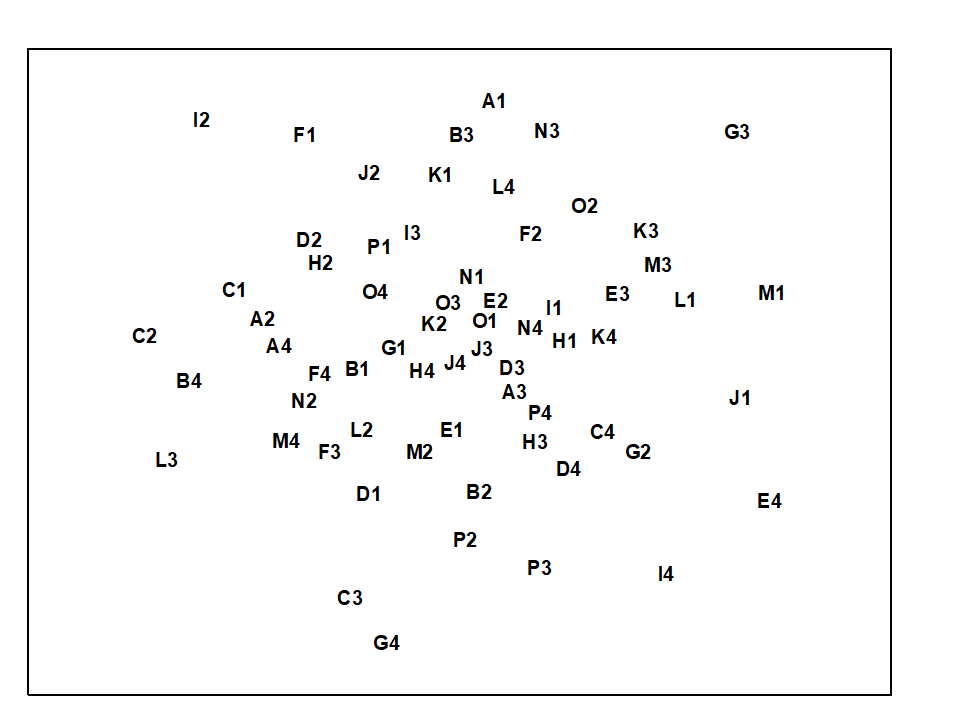
Fig. 6.8. Westerschelde nematodes experiment {w}. MDS of species abundances from 16 different nutrient-enrichment treatments, A to P, applied to sediment cores in each of four mesocosm basins, 1 to 4 (stress = 0.28).
In the absence of replication, a test is still possible in the univariate case, under the assumption that interaction effects are small in relation to the main treatment or block differences ( Scheffe (1959) . In a similar spirit, a global test of H$ _ o$ is possible here, relying on the observation that if certain treatments are responsible for community changes, in a more-or-less consistent way across blocks, separate MDS analyses for each block should show a repeated treatment pattern. This is illustrated schematically in the top half of Fig. 6.9: the fact that treatment A is consistently close to B (and C to D) can only arise if H$_ o$ is false. The analogy with the univariate test is clear: large interaction effects imply that the treatment pattern differs from block to block and there is little chance of identifying a treatment effect; on the other hand, for a treatment $\times$ block design such as the current mesocosm experiment there is no reason to expect treatments to behave very differently in the different basins.
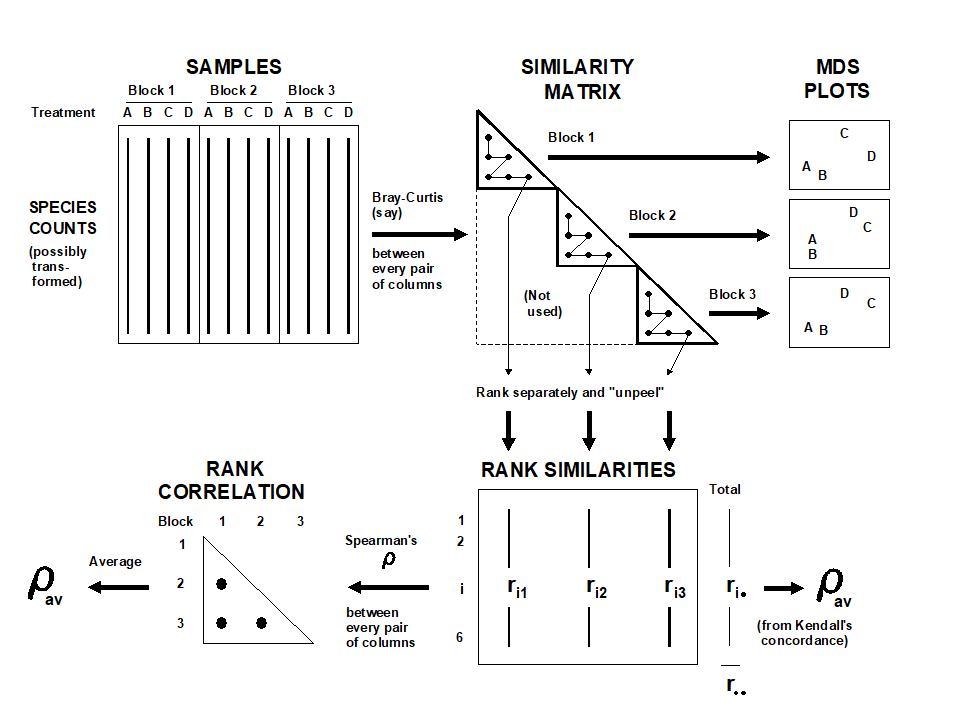 Fig. 6.9. Schematic diagram illustrating the stages in defining concordance of treatment patterns across the blocks, and the two computational routes for$\rho _ {av}$.
What is therefore required is a measure of how well the treatment patterns in the ordinations for the different blocks match; this statistic can then be recomputed under all possible (or a random subset of) permutations of the treatment labels within each block. As previously, if the observed statistic does not fall within the body of this permutation distribution there is significant evidence to reject H$_o$. Note that, as required by the statement of H$_o$, the test makes no assumption about the absence of block effects; between-block similarities are irrelevant to a statistic based only on agreement in within-block patterns.
In fact, for the same reasons advanced for the previous ANOSIM tests (e.g. arbitrariness in choice of MDS dimensionality), it is more satisfactory to define agreement between treatment patterns by reference to the underlying similarity matrix and not the MDS locations. Fig. 6.9 indicates two routes, which lead to equivalent formulations. If there are n treatments and thus N = n(n–1)/2 similarities within a block, a natural choice for agreement of two blocks, j and k, is the Spearman correlation coefficient†
$$ \rho _ {jk} = 1 - \frac {6}{N (N^2 -1)} \sum _ {i=1} ^ N (r_ {ij} - r _ {ik})^2 \tag{6.3} $$
between the matching elements of the two rank similarity matrices {rij, rik; i=1,…,N}, since these ranks are the only information used in successful MDS plots. The coefficients can be averaged across all b(b–1)/2 pairs from the b blocks, to obtain an overall measure of agreement $\rho _ {av}$ on which to base the test. A short cut is to define, from the row totals {$r_ i.$} and grand total $r _{..}$ shown in Fig. 6.9, Kendall's coefficient of concordance ( Kendall (1970) )between the full set of ranks:
$$ W = \frac {12}{b^2 N (N^2 -1)} \sum _ {i=1} ^ N \left( r_ {i.} - \frac{r _ {..}}{N} \right)^2 \tag{6.4} $$
and then exploit the known relationship between this and $\rho _ {av}$:
$$ \rho_{av} = \left( bW - 1 \right) / \left( b - 1 \right) \tag{6.5} $$
As a correlation coefficient, $\rho _ {av}$ takes values in the range (–1, 1), with $ \rho_{av} = 1$ implying perfect agreement and $ \rho_{av} \approx 0$ if the null hypothesis H$_ o$ is true.

Fig. 6.10. Westerschelde nematodes experiment {w}. MDS for the 16 treatments (A to P), performed separately for each of the four basins; no shared treatment pattern is apparent (stress ranges from 0.16 to 0.20).
Note that standard significance tests and confidence intervals for $\rho$ or W (e.g. as given in basic statistical tables) are totally invalid, since they rely on the ranks {$r_{ij}$; i=1,…,N} being from independent variables. This is obviously not true of similarity coefficients from all possible pairs of a set of samples – the samples will be independent but they are repeatedly re-used in calculating the similarities. This does not make $\rho _ {av}$ any the less appropriate, however, as a measure of agreement whose departure from zero (rejection of H$_ o$) is testable by permutation.
For the nutrient enrichment experiment, Fig. 6.10 shows the separate MDS plots for the 4 mesocosm basins. Although the stress values are rather high (and the plots therefore slightly unreliable as a summary of the among treatment relationships), there appears to be no commonality of pattern, and this is borne out by a near zero value for $\rho _ {av}$ of –0.03. This is central to the range of permuted values for $\rho _ {av}$ under H$ _ o$ (obtained by permuting treatment labels separately for each block and recomputing $\rho _ {av}$), so the test provides no evidence of any treatment differences. Note that the symmetry of the 2-way layout also allows a test of the (less interesting) hypothesis that there are no block effects, by looking for any consistency in the among-basin relationships across separate analyses for each of the 16 treatments. The test is again non-significant, with $\rho _ {av} = –0.02$. The negative conclusion to the tests should bar any further attempts at interpretation.
¶ PRIMER 7’s ANOSIM routine automatically switches to attempting the test described here if it finds no replicates to permute. The test will not work for actual or effective 1-way layouts (this is no surprise since univariate ANOVA is powerless to conclude anything if there are no replicates, e.g. in each of 4 treatments it is clearly a silly question to ask: ‘Are the responses 5, 3, 12, 10 different or not?’ if there is no way of assessing the variability in a single number!). But for 2- or 3-factor crossed designs without replication, with enough levels in the tested factor, the test automatically reverts to the correlation method here.
† We will return to this very important concept of a non-parametric matrix (or Mantel) correlation between two resemblance matrices later: it is also at the core of several later Chapters (e.g. 11, 15, 16).