1.8 Example: Nutrient enrichment experiment, Solbergstrand
Table 1.7. Nutrient enrichment experiment, Solbergstrand mesocosm, Norway {N}. Meiofaunal abundances (shown for copepods only) from four replicate boxes for each of three treatments (Control, Low and High levels of added nutrients).
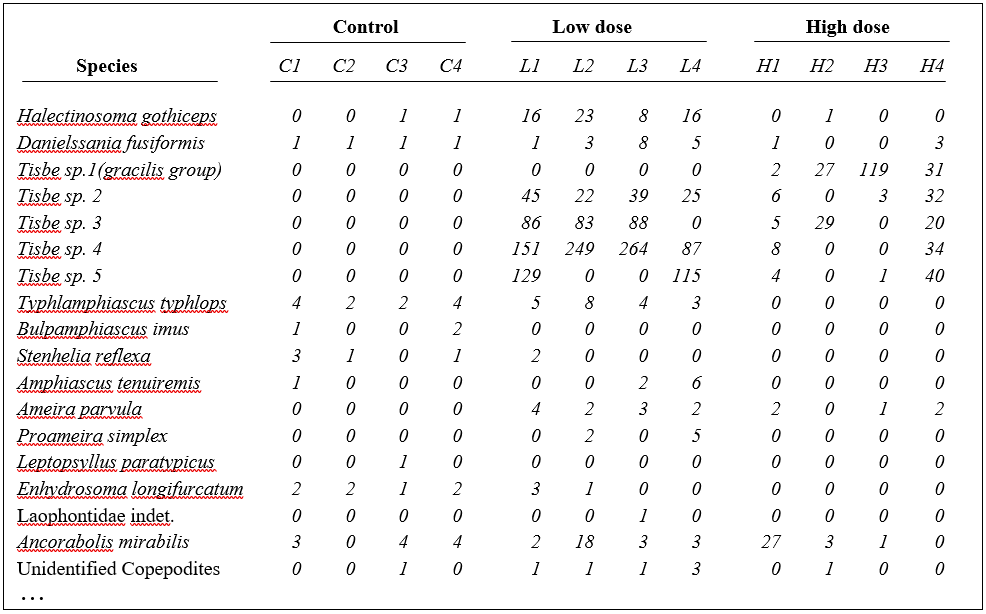
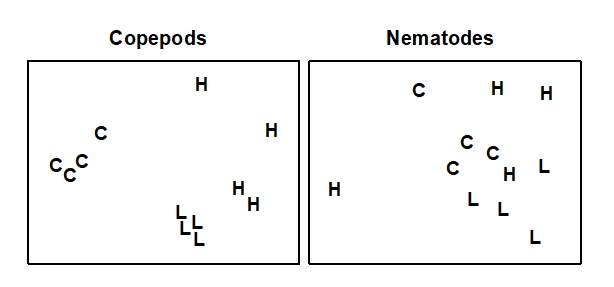
Fig. 1.12. Nutrient enrichment experiment {N}. Separate MDS ordinations of $\sqrt{} \sqrt{}$-transformed abundances for copepod and nematode species, in four replicate boxes from each of three treatments: Control, Low, High. (2-d MDS stresses: 0.09, 0.18)
An example is given in Table 1.7 of meiofaunal community data from a nutrient enrichment experiment in the Solbergstrand mesocosm, Norway {N}, in which 12 undisturbed box cores of sediment were transferred into the mesocosm basins and separately dosed with two levels of increased nutrients (low, L, and high, H), with some boxes remaining undosed (control, C). Fig. 1.12 shows the MDS plots of the four replicate boxes from each treatment, separately for the copepod and nematode components of the meiofaunal communities (see also Chapter 12). For the copepods, there is a clear imputation of a (causal) response to the treatment, though this is less apparent for the nematodes, and requires a test of the null hypothesis of ‘no treatment effect’, using the ANOSIM test of Chapter 6.