5.4 EXAMPLE: Dosing experiment, Solbergstrand
The nematode abundance data from the dosing experiment {D} at the GEEP Oslo Workshop was previously analysed by PCA, see Fig. 4.2 and accompanying text. The analysis was likely to be unsatisfactory, since the % of variance explained by the first two principal components was very low, at 37%. Fig. 5.6c shows the MDS ordination from the same data, and in order to make a fair comparison with the PCA the data matrix was treated in exactly the same way prior to analysis. (The same 26 species were used and a log transform applied before computation of Bray-Curtis similarities). The stress for the 2-dimensional MDS configuration is moderately high (at 0.16), indicating some difficulty in displaying the relationships between these 16 samples in two dimensions. However, the PCA was positively misleading in its apparent separation of the four high dose (H) replicates in the 2-dimensional space; by contrast the MDS does provide a usable summary which would probably not lead to serious misinterpretation (the interpretation is that nothing very much is happening!). This can be seen by superimposing the corresponding cluster analysis results, Fig. 5.6a, onto the MDS. Two similarity thresholds have been chosen in Fig. 5.6a such that they (arbitrarily) divide the samples into 5 and 10 groups, the corresponding hierarchy of clusters being indicated in Fig. 5.6c by thin and thick lines respectively. Whilst it is clear that there are no natural groupings of the samples in the MDS plot, and the groupings provided by the cluster analysis must therefore be regarded with great caution, the two analyses are not markedly inconsistent.
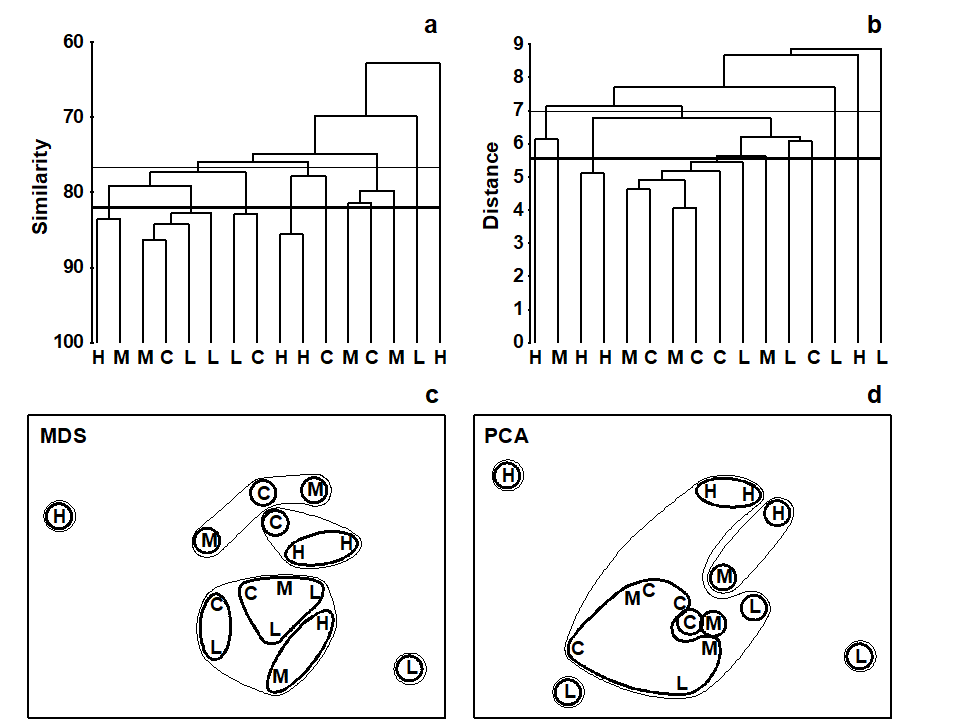
Fig. 5.6. Dosing experiment, Solbergstrand mesocosm {D}. Nematode abundances for four replicates from each of four treatments (control, low, medium and high dose of hydrocarbons and Cu) after species reduction and log transformation as in Fig. 4.2. a), c) Group-averaged clustering from Bray-Curtis similarities; clusters formed at two arbitrary levels are superimposed on the 2-dimensional MDS obtained from the same similarities (stress = 0.16). b), d) Group-average clustering from Euclidean distances; clusters from two levels are superimposed on the 2-dimensional PCA of Fig. 4.2. Note the greater degree of distortion in the latter. (Contours drawn by hand, note, not in PRIMER which only allows convexity of such contours).
In contrast, the parallel operation for the PCA ordination clearly illustrates the poorer distance-preserving properties of this method. Fig. 5.6d repeats the 2-dimensional PCA of Fig. 4.2 but with superimposed groups from a cluster analysis of the Euclidean distance matrix (the implicit distance for a PCA) between the 16 samples (Fig. 5.6b). With the same division into five clusters (thin lines) and ten clusters (thick lines), a much more distorted picture results, with samples that are virtually coincident in the PCA plot being placed in separate groups and samples appearing distant from each other forming a common group.
The outcome that would be expected on theoretical grounds is therefore apparent in practice here: MDS (with a relevant similarity matrix for species data, Bray-Curtis) can provide a more realistic picture in situations where PCA (on Euclidean distance) gives a distorted representation of the those distance relationships among samples, because of the projection step: the H samples are not clustered together in the dendrogram. In fact, the biological conclusion from this particular study is entirely negative: the ANOSIM test (Chapter 6) shows that there are no statistically significant differences in community structure among any of the four dosing levels in this experiment.