1-way ordered without replication
In the unordered 1-way design, replication is essential for any sort of test (otherwise how can you tell whether single samples from groups A, B, C, … are from the same or different communities? – there are no within-group rank dissimilarities to compare with among-group ones). For the ordered 1-way design, however, the test statistic R$^\text{O}$ can still be constructed – see the explanation in CiMC Chapter 6 under ANOSIM for ordered factors, where the statistic for the unreplicated design is designated R$^\text{Os}$, for ordered single, rather than R$^\text{Oc}$, for ordered category (though in both cases it is fundamentally the same slope statistic R$^\text{O}$ from a regression of rank dissimilarities against modelled rank distances under the alternative hypothesis). A univariate analogue you may find it helpful to think about is testing whether differences in a variable y bear any relation to given values of x. If you are not prepared to make any assumptions about the form of the relationship (the alternative hypothesis just says the values of y differ with those of x in some way unspecified) then you must have replicates at each x value in order to construct an (ANOVA-type) test. If, however, you set out to examine the alternative hypothesis that the relationship between y and x is linear, then there is a perfectly viable test without any replication of x levels, i.e. whether the slope of a linear regression of y on x is significantly different from zero. And you may choose that linear regression test even when there are replicates at each x level. This is actually a very precise analogue of the difference between ordered R$^\text{O}$ (regression-type) and unordered R (ANOVA-type) ANOSIM tests.
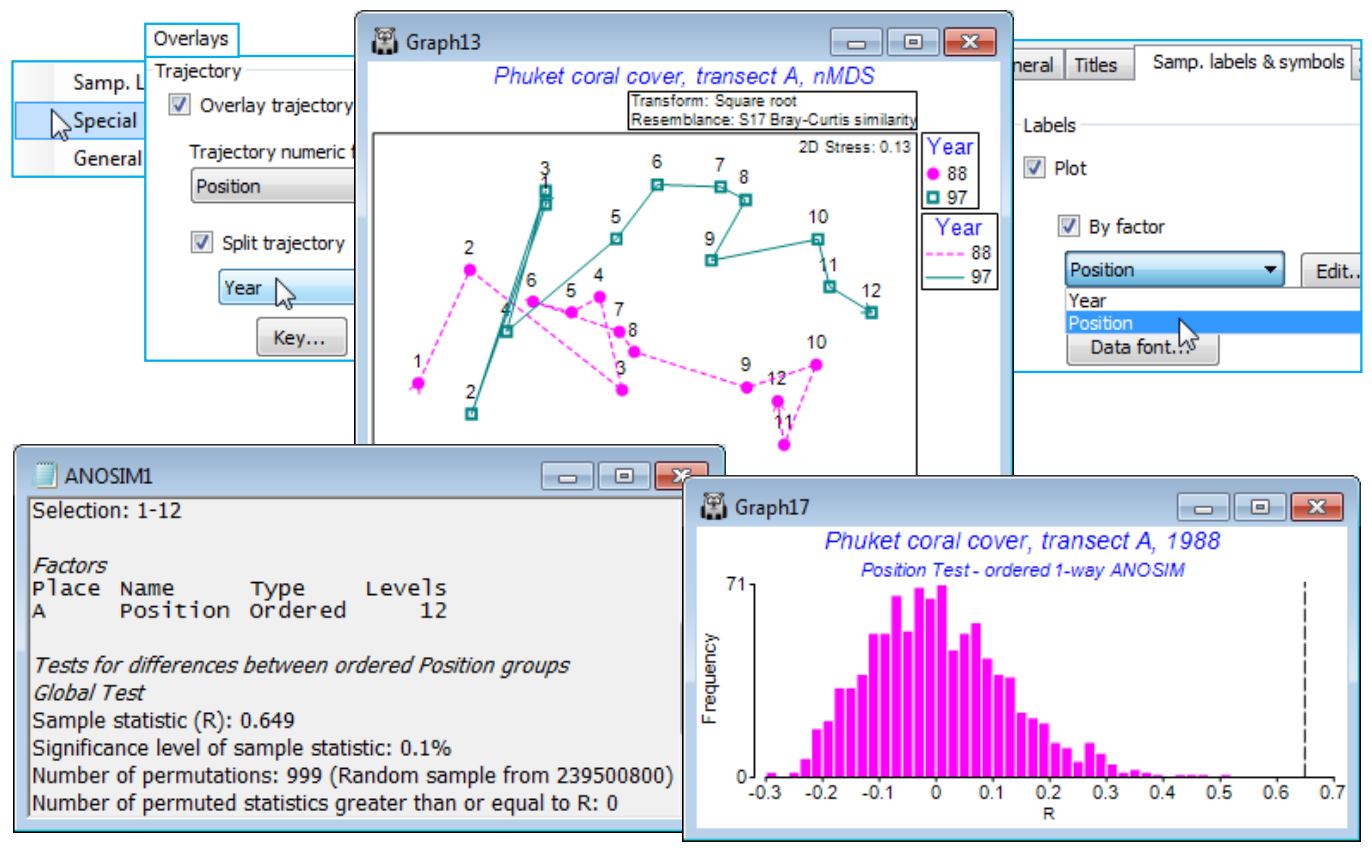
So, for the Phuket coral cover 88-97 data, take a square-root transform and Bray-Curtis similarities, selecting from the latter the first and last years 88 and 97 (i.e. 24 samples, the 12 transect positions in each year) and reproduce the nMDS plot seen in Fig. 6.14 of CiMC – with separate trajectories over transects for each year by taking Graph>Special>Overlays>(✓Overlay trajectory Position)> (✓Split trajectory Year) and on Samp. labels & symbols, (Labels✓Plot)>(✓By factor Position). It is scarcely necessary to test the null hypothesis of no Position effect for each of these years but a 1-way ordered test (without replicates) can be carried out by selecting each year in turn, and Analyse >ANOSIM>(Model•One-Way - A)>(Factors A: Position)>(Type Ordered) gives R$^\text{Os}$ = 0.65 and 0.73 respectively (both p<0.1%).

