Normalising variables
It is typical of a suite of physico-chemical variables (or biomarkers, water-quality indices etc) that they are not on comparable measurement scales, unlike assemblage abundances. All multivariate analysis methods are based on resemblances between samples that add up contributions across the variables. This make no sense if there is not a common scale (transformation does not help in this regard). If the similarity or distance coefficient does not have some form of internal adjustment to put variables onto a common scale (the commonly used Euclidean or Manhattan distance measures do not), then it is important to pre-treat the data to achieve this. The standard means of doing so is normalising. Literature terminology is inconsistent here, but what PRIMER means by normalising is that from each entry of a single variable we subtract the mean (across all samples) and divide by the standard deviation of that variable. This is carried out separately for each variable. It is simply a scale and location change, and does not change the shape of the histograms above, for example. It does not therefore ‘convert the variable to normality’ – this is essentially what the transformation is trying (approximately) to achieve – but it makes the mean 0 and standard deviation 1, so that all variables now take values over roughly the same limits: typically (for a normal distribution) the range –2 to +2 covers roughly 95% of the entries, making contributions to (say) Euclidean distance from different variables comparable, and effectively giving each variable the same weight. This process is sometimes known, especially in the statistical literature, as standardisation, but PRIMER reserves the term standardise for scaling positive quantities only, by dividing by their total or maximum. Standardisation would therefore not succeed in putting onto a common scale variables for which zero is not a meaningful (and attained) end point of the scale, as is true for of many abiotic variables, such as temperature. And in a marine context, salinities may fluctuate over a narrow – but still potentially important – range well away from zero; standardisation (of variables) would then be completely ineffective. Note that, unlike standardising, normalising only makes sense – and is therefore only offered – for variables, not for samples.
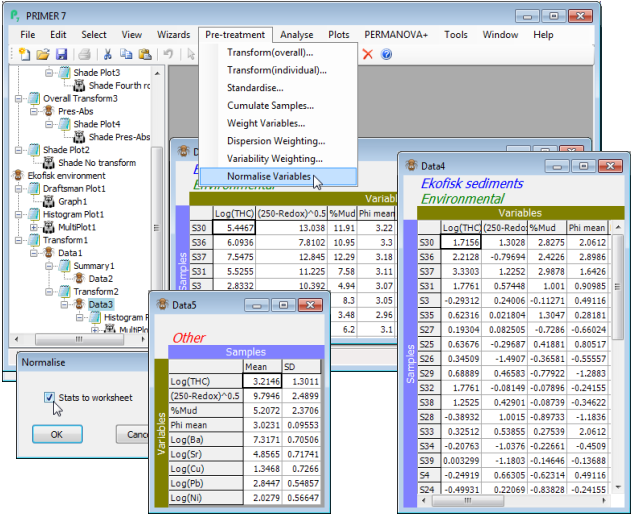
On the transformed environmental variable matrix from the previous page, take Pre-treatment> Normalise variables>(✓Stats to worksheet), and note how the resulting variables now take values over comparable ranges, roughly –2 to +2. They are now ready for entry to Analyse>Resemblance>(Measure•Euclidean distance), using the methods of Section 5. Save Ekofisk wk.

