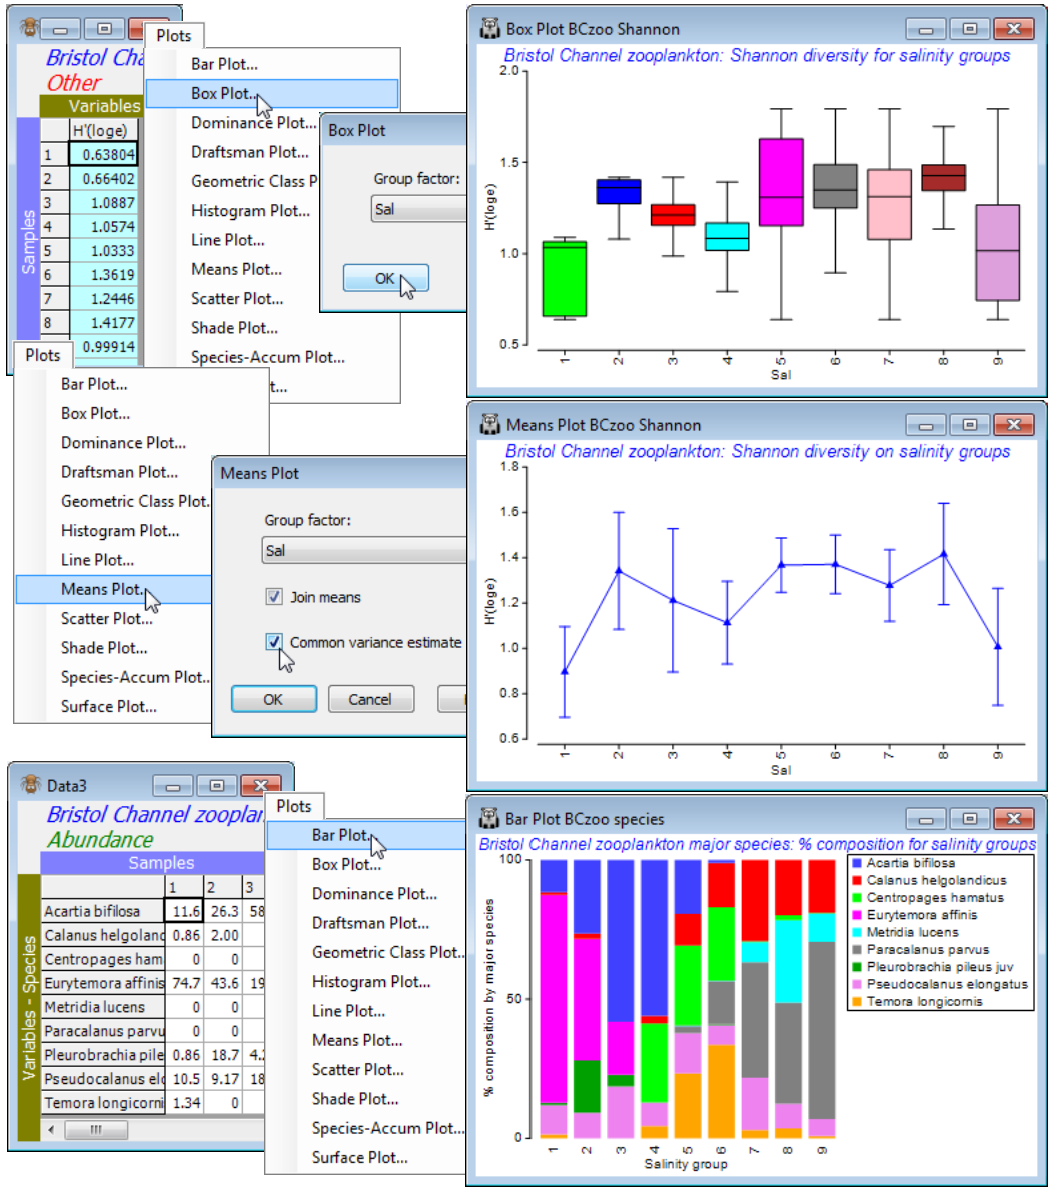
Plots menu
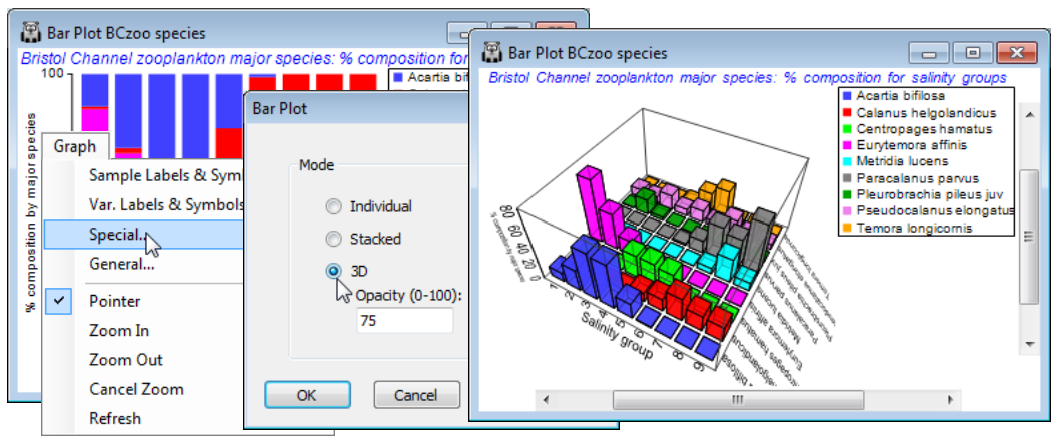
PRIMER 7 has a new Plots main menu, available when the active window is a data matrix. This brings together a number of standard plot formats, and more specialised ones, relevant to a range of multivariate analyses. Some are similar or identical to those in PRIMER 6, e.g. Plots>Dominance Plot, Geometric Class Plot and Species-Accum Plot (Section 16), and Draftsman Plot (already seen in Section 4 and again in Section 13). Others are new to PRIMER 7: the Histogram Plot was seen earlier (Section 4), as were Scatter Plot (Section 5) and Surface Plot (end of Section 4 and in Section 5). A significant new feature in PRIMER 7, the specialised Shade Plot, was introduced in Section 4 as a means to aid pre-treatment choice and is discussed in more detail in Section 10, in the context of interpreting species patterns across samples. There is a similar context for Line Plot, in the form of a multi-plot created by Wizards>Coherence plots, seen in Section 10, and the other three plot types in this menu are also standard graphic constructions: a Bar Plot can show relative composition of different species in each of a set of (averaged) samples, and Box Plot and Means Plot (Section 15) provide standard univariate tools pre- and post-hypothesis testing for a one-way layout, e.g. the latter giving confidence intervals for effect sizes (generalised to multivariate data by the bootstrap region plots of Section 17, under Analyse>Bootstrap Averages on resemblances).
Save and close the Bristol Channel workspace, Bristol Channel ws.


