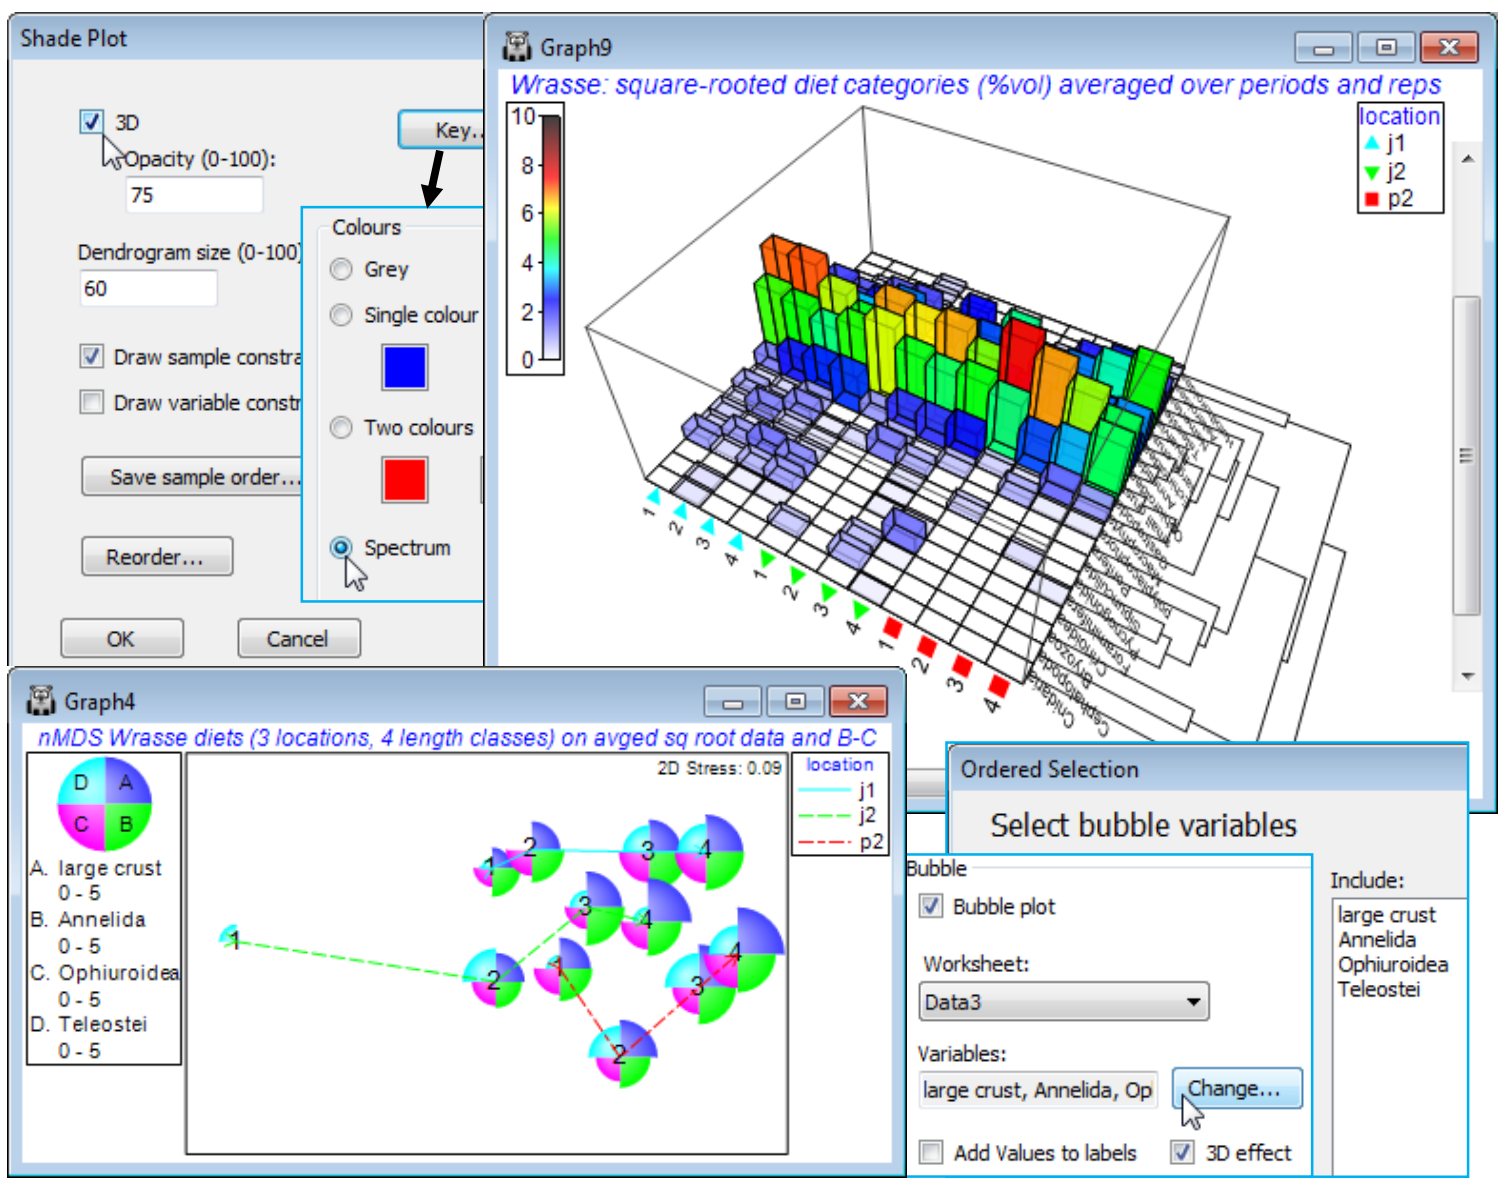
3-d shade plot
A further option on the initial Special menu for a shade plot (✓3D>Opacity (0-100): 75) turns the 2-d matrix into a 3-d bar plot, also carrying across any dendrograms and sample or variable labels and symbols on the axes. The (transformed) quantities in the cells of the matrix are represented in two ways, both by the height of the bars and by their colour, with the same scale key as for the 2D plot. The default value for opacity (75%) allows some viewing of bars through other bars, and smaller values, of course, lead to greater transparency (and an inevitably lightened colour scale). As for similar 3D plots, this can be manually rotated, or automatically spun with Graph>Spin, allowing the usual options for rotation speed and capturing the animation as an *.mp4 file etc.

